Webhook
Send logs to Jutsu from anything that can make an HTTP request: a syslog daemon collecting from your appliances, a log shipper you already run, or a product's "send logs to HTTP" export. You register a webhook in Jutsu and get one endpoint URL and a token. Nothing is installed anywhere. Events posted to the endpoint go through the same pipeline as agent traffic: normalization, detections, search, and retention.
| Time | About 5 minutes, plus configuring your sender |
|---|---|
| You need | A sender that can make HTTPS POST requests with an Authorization header (or Basic auth), and the Owner or Admin role in your Jutsu organization |
| Network | The sender must reach api.jutsu.ai on port 443 |
| Collected | webhook.json, webhook.syslog, and webhook.text |
Webhook or agent? For a server's own sign-in and sudo events, install the Linux / Unix host agent: it buffers on disk and reports its health for you. Use a webhook when something already produces the logs and can post them over HTTP. Buffering and retries are then up to the sender.
Step 1 - Open Integrations
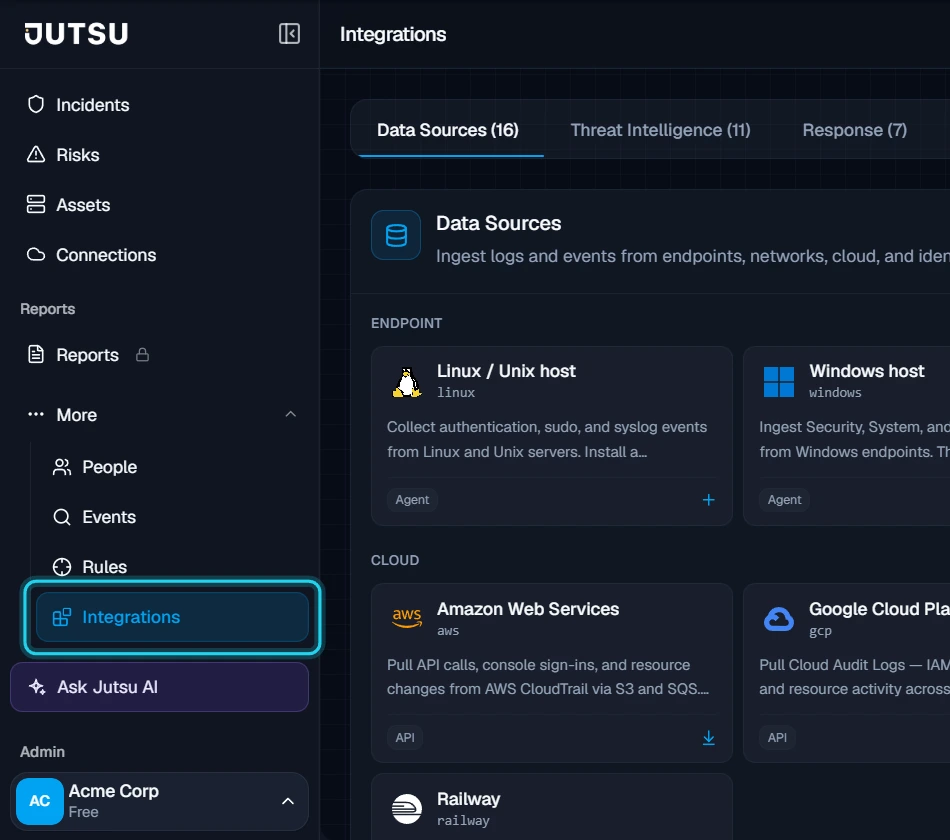
Go to app.jutsu.ai and select Integrations in the left navigation. It sits under More. The Data Sources tab opens by default.
Step 2 - Select the Webhook card
Scroll down to the Custom section and select the Webhook card. The Register a webhook dialog opens.
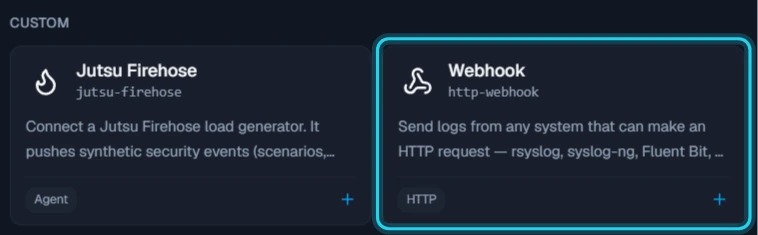
The card doesn't open? Adding integrations needs the Owner or Admin role in your Jutsu organization. For Analysts, Responders, and Viewers the catalog is read-only.
Step 3 - Register the webhook
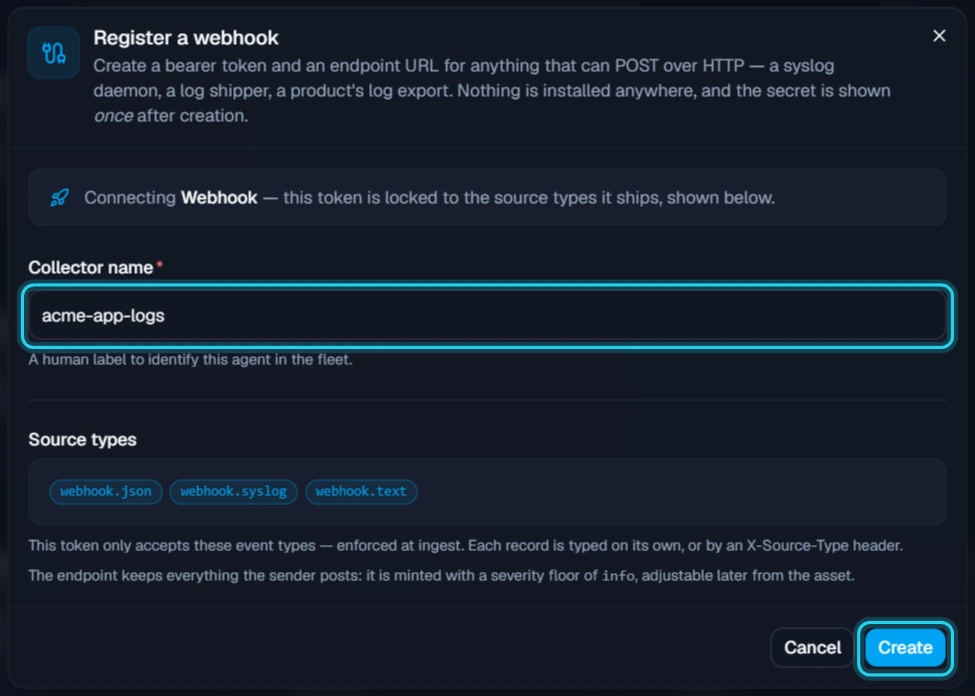
Under Collector name, replace the suggested http-webhook-01 with a name that says what will post to it, for example acme-app-logs. This is the name the webhook has in Jutsu.
The token accepts three source types: webhook.json, webhook.syslog, and webhook.text. Each record you send is typed on its own (see How records are typed). The webhook starts with a severity floor of info, so everything you send is visible to detection.
Select Create.
Register one webhook for each sender, or for each group of devices that share a sender. Creating it uses one connected-asset slot on your plan.
Step 4 - Copy the endpoint and token
The Webhook registered dialog shows the endpoint, https://api.jutsu.ai/webhook, and the token. Jutsu shows the token only once, so select Copy token and store it where your sender's configuration will read it, before you select Close.
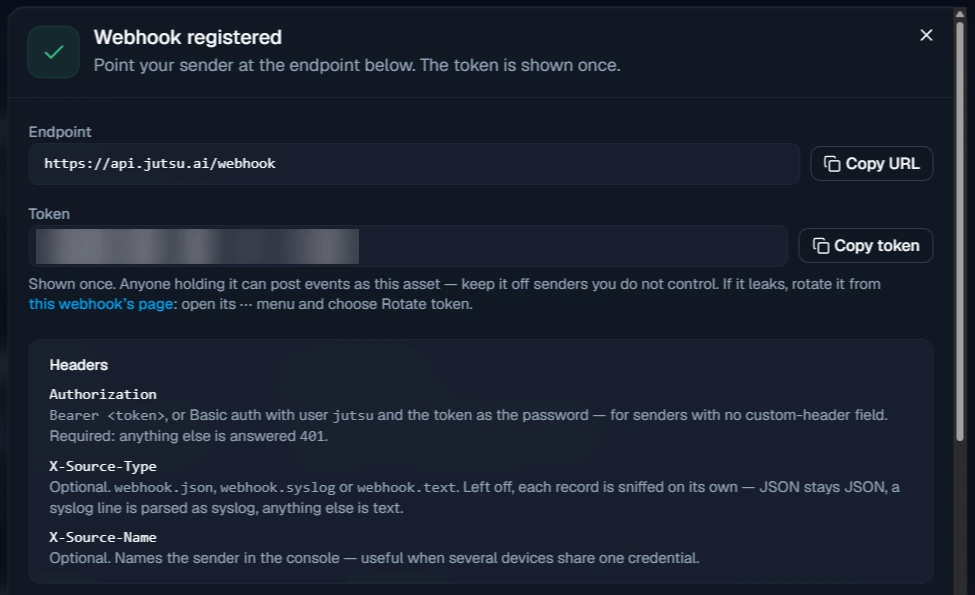
The endpoint reads three headers:
| Header | What it does |
|---|---|
Authorization | Required. Bearer <token>. For senders with no custom-header field, use Basic auth instead, with the user jutsu and the token as the password. Anything else is answered 401. |
X-Source-Type | Optional. webhook.json, webhook.syslog, or webhook.text forces the type of every record in the request. Any other value is answered 401. |
X-Source-Name | Optional. Names the sender in Jutsu, which helps when several devices share one webhook. The default is webhook. |
Content-Type isn't checked, so send whatever your sender sends. Bodies compressed with Content-Encoding: gzip are accepted.
Step 5 - Configure your sender
Below the headers, the dialog has ready-made configuration for curl, rsyslog, syslog-ng, Fluent Bit, and Vector, with your endpoint and token already filled in. The curl tab has examples for a single JSON event, a JSON array, newline-delimited JSON, a syslog line, and Basic auth. Select Copy to copy one.
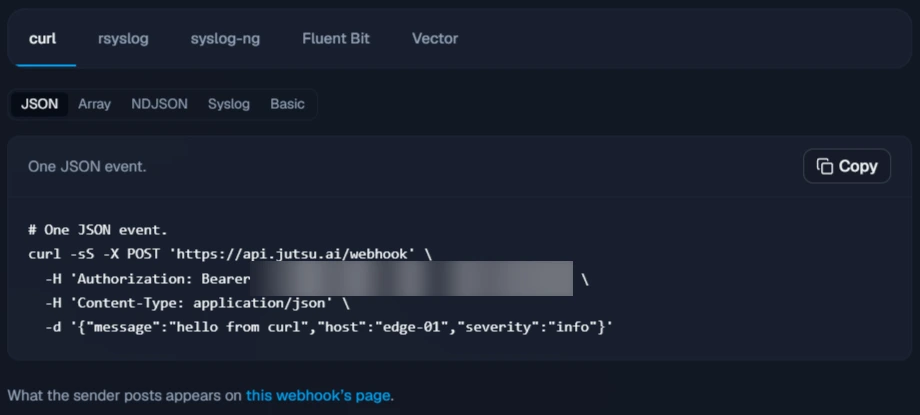
The same configurations follow, with jcol_YOUR_TOKEN_HERE in place of your token.
rsyslog (omhttp module, rsyslog 8.2001 or newer; it's the rsyslog-omhttp package on Debian and RHEL):
# /etc/rsyslog.d/60-jutsu.conf — POST https://api.jutsu.ai/webhook
module(load="omhttp")

action(
  type="omhttp"
  server="api.jutsu.ai"
  serverport="443"
  usehttps="on"
  # restpath takes the path WITHOUT a leading slash — omhttp adds it.
  restpath="webhook"
  httpheaders=["Authorization: Bearer jcol_YOUR_TOKEN_HERE"]
  batch="on"
  batch.format="newline"              # one syslog line per body line
  template="RSYSLOG_SyslogProtocol23Format"   # RFC5424: real timestamp + host
  action.resumeRetryCount="-1"        # never drop on a transient 5xx
  queue.type="LinkedList"
  queue.filename="jutsu_webhook"      # disk-assisted: survives a restart
  queue.maxDiskSpace="512m"
  queue.saveOnShutdown="on"
)
syslog-ng (http() destination):
# /etc/syslog-ng/conf.d/jutsu.conf
destination d_jutsu {
  http(
    url("https://api.jutsu.ai/webhook")
    method("POST")
    headers("Authorization: Bearer jcol_YOUR_TOKEN_HERE")
    body("<${PRI}>1 ${ISODATE} ${HOST} ${PROGRAM} ${PID} - - ${MSG}")
  );
};

log { source(s_local); destination(d_jutsu); };
Fluent Bit (http output):
# /etc/fluent-bit/fluent-bit.conf — POST https://api.jutsu.ai/webhook
[OUTPUT]
    name              http
    match             *
    host              api.jutsu.ai
    port              443
    tls               on
    uri               /webhook
    format            json
    header            Authorization Bearer jcol_YOUR_TOKEN_HERE
    json_date_key     timestamp
    json_date_format  iso8601
Vector (http sink):
sinks:
  jutsu_webhook:
    type: http
    inputs: [my_source]
    uri: "https://api.jutsu.ai/webhook"
    method: post
    compression: gzip
    encoding: { codec: json }
    framing:
      method: newline_delimited
    request:
      headers:
        Authorization: "Bearer jcol_YOUR_TOKEN_HERE"
        X-Source-Name: "<hostname>"
    batch: { max_events: 200, timeout_secs: 2 }
    buffer: { type: disk, max_size: 536870912, when_full: drop_newest }
Buffer on the sender: The endpoint only answers once events are safely buffered on Jutsu's side, so an outage slows the sender down instead of losing events. That only helps if the sender keeps a queue. The rsyslog disk-assisted queue and the Vector disk buffer above do this, and so does Fluent Bit's storage.type filesystem.
At the bottom of the dialog, a note on Time explains how event times are read.
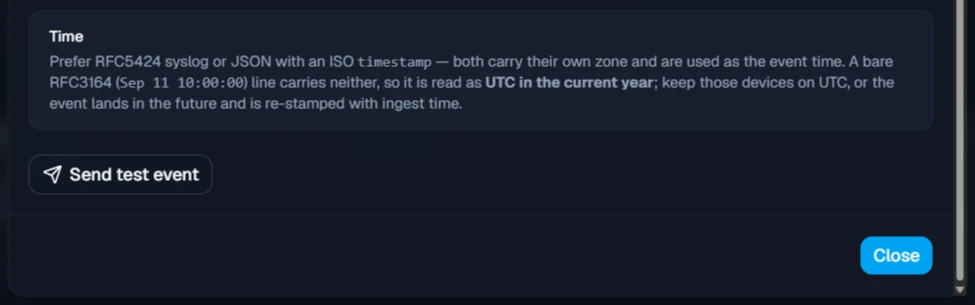
Send timestamps with a time zone: RFC5424 syslog, or JSON with an ISO 8601 timestamp. A classic RFC3164 syslog line (Sep 11 10:00:00 …) has no zone or year, so it is read as UTC in the current year. Keep devices that send that format on UTC. An event more than 5 minutes in the future is stamped with the time Jutsu received it instead.
Step 6 - Send a test event
Send test event posts one event to the endpoint for you. Accepted — the endpoint took the event means the token works.
You can also test from your own network, which checks the same path your sender will use. To keep the token out of your shell history, read it into a variable first: run read -rs JUTSU_TOKEN && export JUTSU_TOKEN, paste the token, and press Enter. Then post a JSON event, a newline-delimited batch, and a syslog line:
curl -sS -o /dev/null -w '%{http_code}\n' https://api.jutsu.ai/webhook \
  -H "Authorization: Bearer $JUTSU_TOKEN" \
  -d '{"message":"checkout failed: card declined","host":"acme-app-01","user":"alex","severity":"warning"}'

curl -sS -o /dev/null -w '%{http_code}\n' https://api.jutsu.ai/webhook \
  -H "Authorization: Bearer $JUTSU_TOKEN" \
  --data-binary $'{"message":"user signed in","user":"alex"}\n{"message":"password reset requested","user":"jordan"}'

curl -sS -o /dev/null -w '%{http_code}\n' https://api.jutsu.ai/webhook \
  -H "Authorization: Bearer $JUTSU_TOKEN" \
  --data-binary "<38>1 $(date -u +%Y-%m-%dT%H:%M:%SZ) acme-edge-01 sshd 913 - - Failed password for root from 203.0.113.50 port 51122 ssh2"
Each request should print 200.

A 200 means every record in the request reached a durable buffer and will be written. A 401 means nothing was ingested: check the token and the Authorization header.
What you can send
The endpoint reads the whole body as one document first, and line by line if that fails:
| Body | Result |
|---|---|
| One JSON object, compact or pretty-printed | 1 event |
| A JSON array | 1 event per element |
| Newline-delimited JSON | 1 event per line |
| Syslog or plain-text lines | 1 event per line |
| A mix of JSON, syslog, and text lines | Each line is typed on its own |
| A malformed JSON line | Kept as text, with the raw line as the message. It's never rejected |
Blank lines, an empty body, or [] | Ignored, answered 200 |
How records are typed
Without an X-Source-Type header, each record gets one of the three types:
| The record | Type | What happens |
|---|---|---|
| Parses as JSON | webhook.json | Common fields are mapped (table below). Every other key stays on the event and is searchable |
Starts with a syslog priority (<13>) or a syslog timestamp, and parses as syslog | webhook.syslog | Parsed for host, application, and severity, then classified the same way as agent logs |
| Anything else | webhook.text | The line becomes the message |
Because syslog lines are classified like agent logs, forwarded sshd and sudo lines produce the same events an agent would, and the built-in SSH detections run on them. An sshd Failed password line, for example, becomes a Medium Authentication event with the user, source IP, and port.
For JSON records, the first of these keys that is present fills each field:
| Keys in your JSON | Becomes |
|---|---|
message, msg | The event message |
host, host_name, hostname | Device hostname |
severity | The event's severity (info, low, warning/medium, error/high, critical) |
timestamp, @timestamp | The event time |
user, user_name, username | User |
src_ip, source_ip / dst_ip, destination_ip | Source and destination IP, enriched with geo and ASN |
src_port / dst_port | Ports |
process, process_name / cmdline, command_line | Process and command line |
file_path, path / file_hash, hash | File path and hash |
url, domain | URL and domain |
mitre_tactic, mitre_technique | MITRE ATT&CK tactic and technique |
Include a timestamp or a unique ID on every event. If a sender retries a request, Jutsu de-duplicates identical events on a best-effort basis only.
Verify the connection
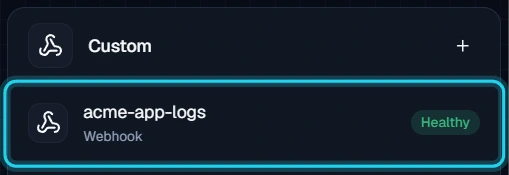
In Jutsu, open Connections. The webhook appears under Custom as Healthy, with Webhook under its name.
Open the webhook. Its header shows its health and when the last event arrived.
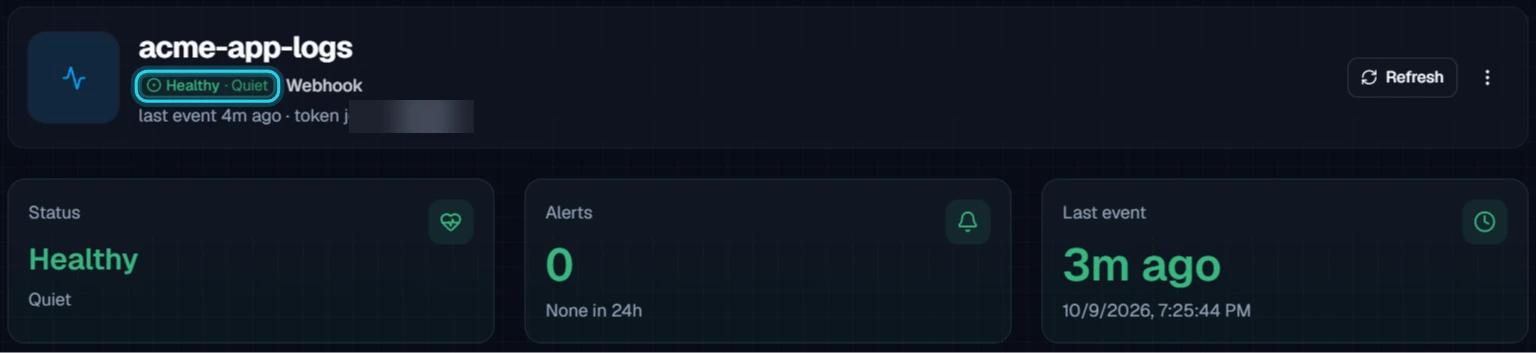
A webhook has no agent, so it has no heartbeat. Its health comes from deliveries: Healthy · Receiving within two minutes of the last event, and Healthy · Quiet within the hour after that. After an hour without events it shows Needs attention · No data in over an hour.
A quiet webhook doesn't page anyone: Webhooks don't raise the offline alerts that agents do, because a sender that posts once an hour or once a week is just as healthy as a busy one. If you need to know when a sender stops, check the webhook's last event.
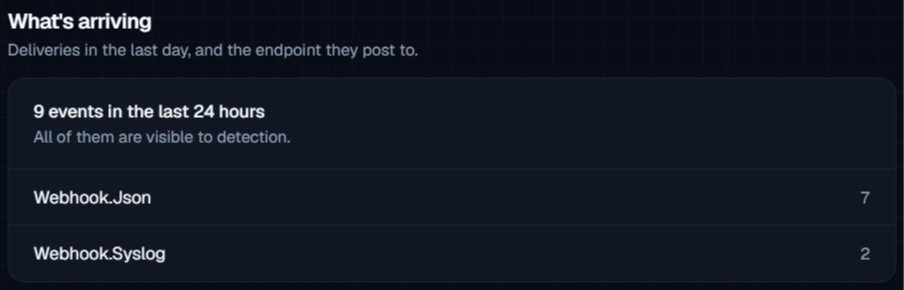
On the Overview, What's arriving counts the events of the last 24 hours by type.
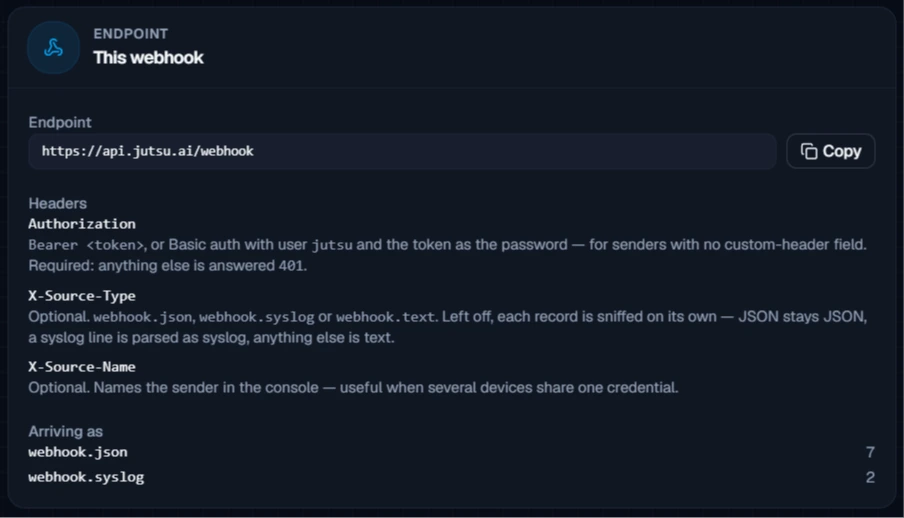
The This webhook card repeats the endpoint and the headers, and Arriving as shows how many events arrived as each source type.
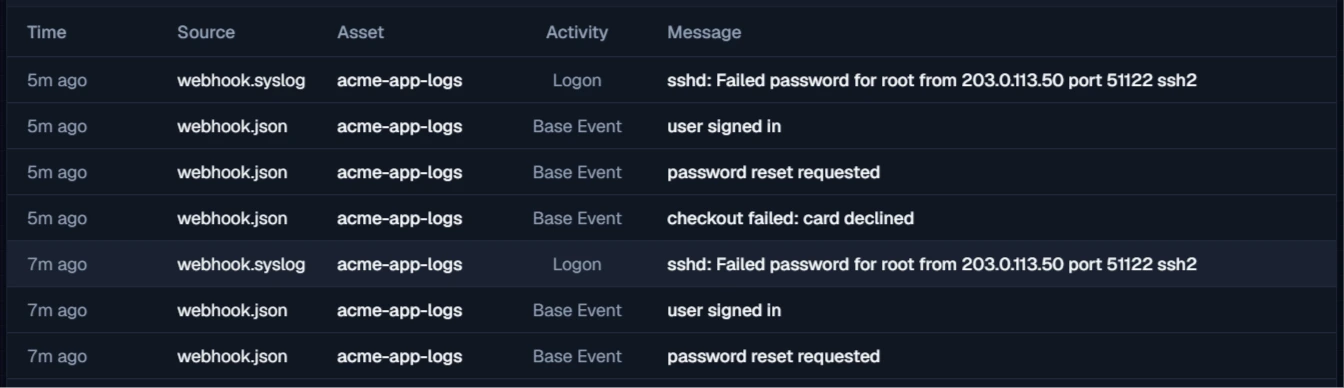
The Events tab lists the events as they arrive. The JSON events show their message, and the forwarded sshd line arrived as an Authentication Logon. Open an event to see all its fields.
Under Configure → Settings, the Details card lists the allowed source types and the minimum severity, which is All events (info) for a webhook.
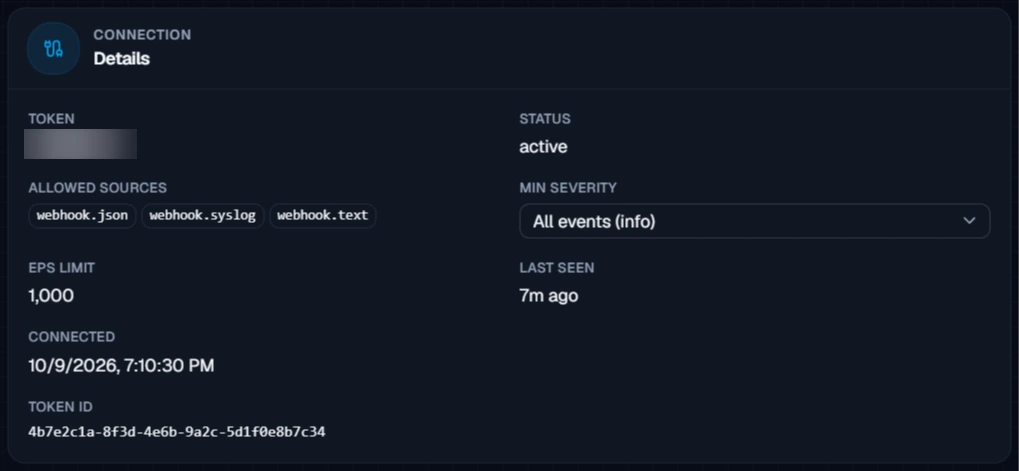
If a chatty sender floods detection with routine events, raise Min severity here. Events below the floor are still kept in raw retention.
Troubleshooting
| Symptom | What to do |
|---|---|
401 on every request | Check the header is Authorization: Bearer jcol_…, or use -u jutsu:jcol_… for Basic auth. A token from a Linux, Docker, or other agent card is refused here: use the webhook's own token. |
401 only when you set X-Source-Type | Use webhook.json, webhook.syslog, or webhook.text, or leave the header off. |
401 right after rotating the token | The old token's grace window ended. Put the new token in the sender's configuration. |
200, but the events aren't in the Events tab | They're below the webhook's Min severity. Lower it under Configure → Settings. |
200, and nothing arrives anywhere | The sender is posting to the wrong host or path. The path is /webhook. Send the curl test from Step 6 with the same token: if that arrives, compare the sender's configuration with it. |
| Several JSON objects arrived as one event | Separate them with real newlines, or send a JSON array. In a shell, $'…\n…' sends a newline. |
| Events arrive with the wrong time | Send RFC5424 syslog or JSON with an ISO 8601 timestamp. If a device must send RFC3164 syslog, set it to UTC. |
| Send test event says Endpoint unreachable | Jutsu couldn't reach the listener from its own side. Send the curl test from Step 6: if it's answered 200, the webhook works. |
Security and access
- The token only accepts the three webhook source types, and Jutsu enforces that at ingest.
- Anyone who holds the token can post events as this webhook. Keep it off senders you don't control, and register a separate webhook for each sender so you can revoke one without affecting the others.
- Archiving or revoking stops the token within seconds. In rare cases, an old token can keep working for up to 30 minutes.
- A rejected request has already been uploaded before it's answered
401. It isn't ingested, but it still uses the sender's bandwidth.
Rotate the token
On the webhook's page, open the ⋯ menu and select Rotate token. Choose a Grace window in minutes, from 0 to 1440 (the default is 60). The old token keeps working until the window ends, and 0 stops it immediately. Put the new token in your sender's configuration before the window ends.
Remove the webhook
Archiving a webhook revokes its token in Jutsu. Then stop or re-point the sender, or it keeps retrying.
Step 1 - Archive the webhook
Open the webhook, go to Configure → Danger zone, and select Archive collector.
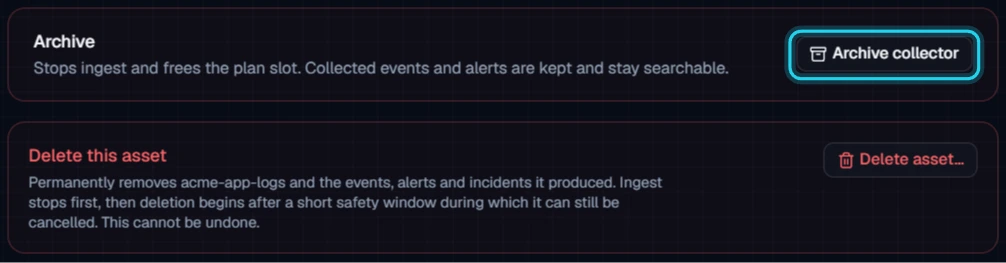
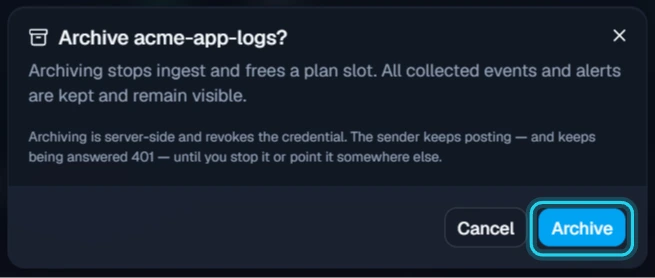
Select Archive to confirm. Archiving stops ingest, frees the plan slot, and revokes the token. Events and alerts already collected stay searchable.
Step 2 - Stop the sender
The Collector archived dialog reminds you to stop or re-point the sender. There's nothing to uninstall.
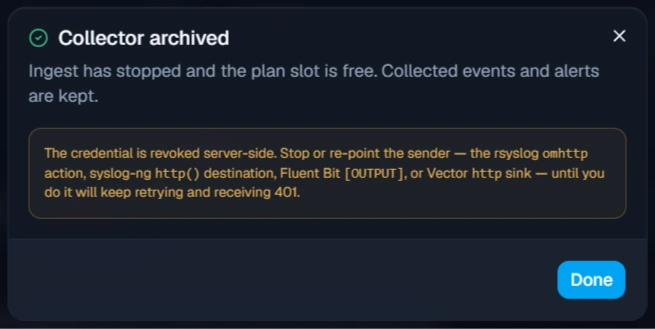
Remove the rsyslog omhttp action, the syslog-ng http() destination, the Fluent Bit [OUTPUT] block, or the Vector http sink. Until you do, the sender keeps posting and every request is answered 401.

Changed your mind? Archived webhooks are listed under Connections → Archived connections, where you can Restore one. You can also select Unarchive on its page. Then send the curl test from Step 6 to check the sender's token is accepted.