Inside an Alert – Alert Detail
Click any row in the Alerts list to open the Alert Detail. This is the full output of the AI pipeline for that specific event.
Check the case banner first
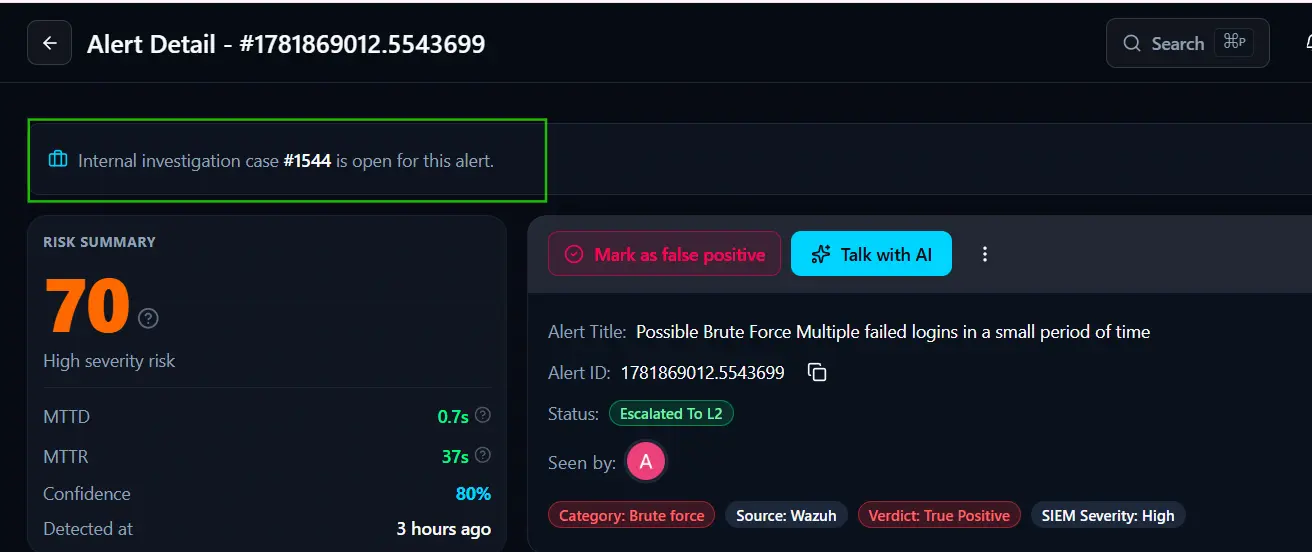
If the banner shows 'Internal investigation case #[N] is open for this alert,' a Case already exists. Click Open case and work the investigation there. Investigating on the alert directly just duplicates work.
Risk Summary
The Risk Summary panel on the left shows the following:
- Risk score -- A number from 0 to 100 displayed in large text with a severity label below it. In this example the score is 70, labeled High severity risk. Click the question mark icon next to the score to open the Score Breakdown, which explains exactly how the score was calculated.
- MTTD -- Mean Time to Detect for this specific alert. Click the question mark to see how it is measured.
- MTTR -- Mean Time to Resolve for this specific alert. Click the question mark to see how it is measured.
- Confidence -- How certain the AI is about its verdict, as a percentage. 80% means the AI had strong, consistent signal from multiple independent sources.
- Detected at -- How long ago this alert was first generated, for example "3 hours ago."
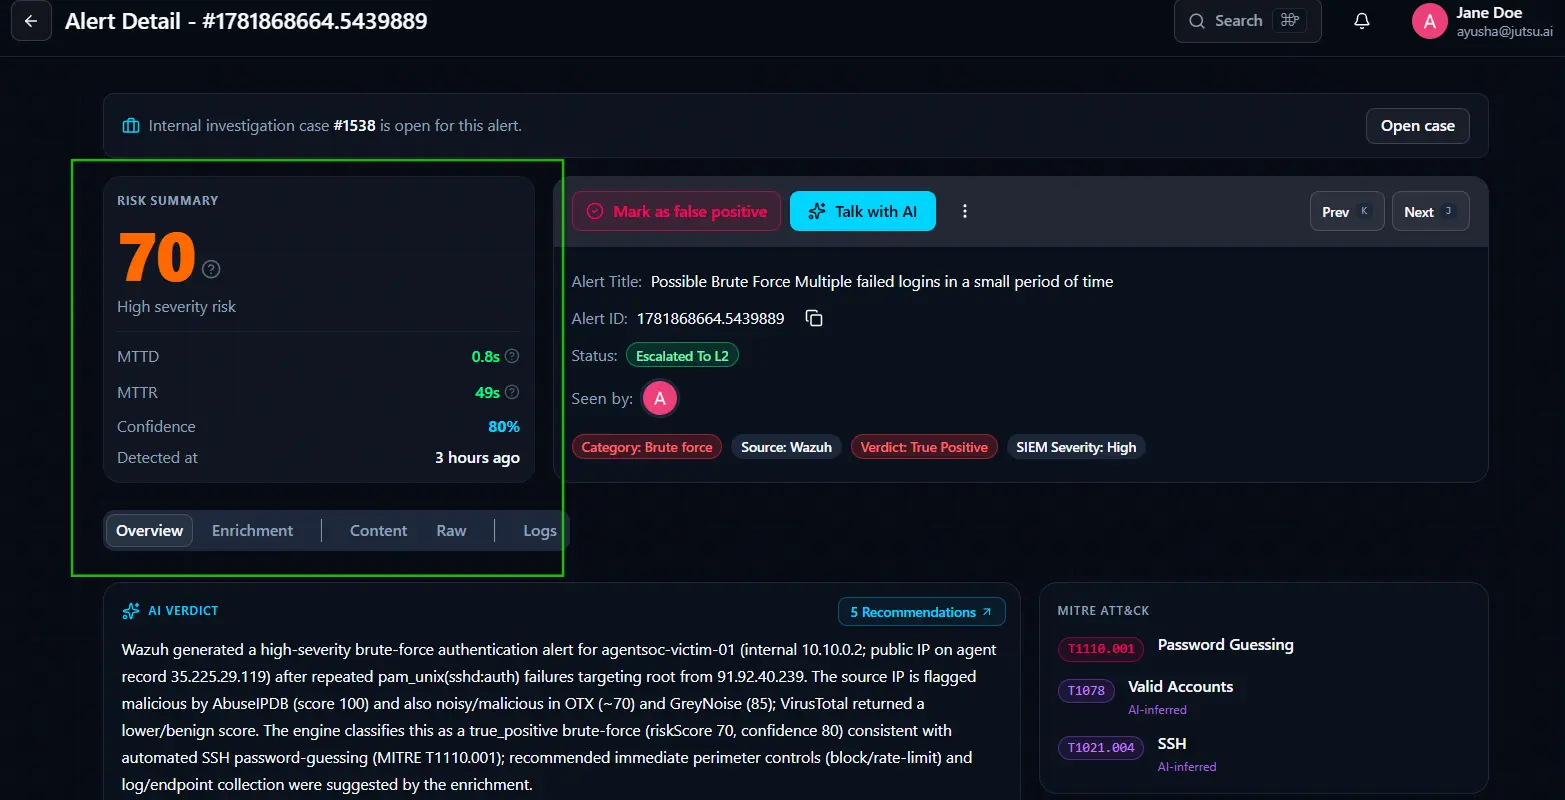
Alert metadata tags
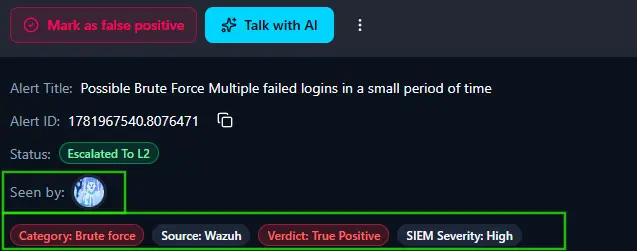
Below the toolbar: the Category tag (attack type, e.g. Brute force), Source tag (originating tool, e.g. Wazuh), Verdict tag (AI classification), and SIEM Severity tag (priority assigned by the originating SIEM).
The Seen by avatars show which teammates have already opened this alert.
Alert ID and copy button
The Alert ID shown in the alert metadata includes a copy button. Click it to copy the full alert identifier to your clipboard -- useful when referencing an alert in a support ticket or discussion note.
Score Breakdown
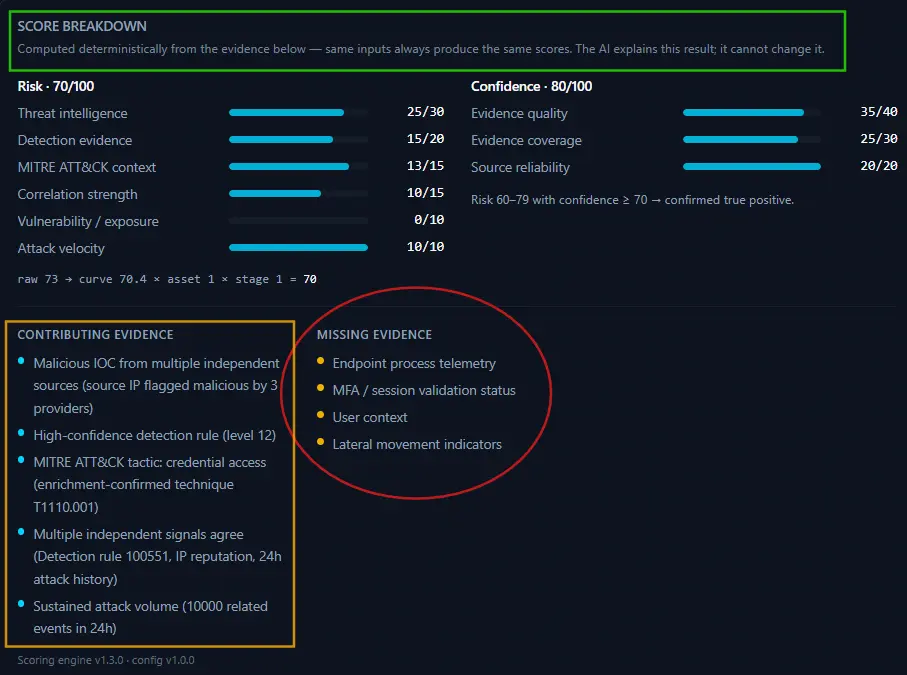
The Score Breakdown is computed deterministically from the evidence below -- the same inputs always produce the same scores. The AI explains this result but cannot change it.
Risk -- /100
Six factors contribute to the risk score, each with a maximum possible value:
- Threat Intelligence -- How many TI providers flagged the observables and at what confidence. Maximum 30.
- Detection evidence -- The strength and specificity of the rule that triggered. Maximum 20.
- MITRE ATT&CK context -- Whether the matched technique was confirmed by enrichment or inferred by the AI. Maximum 15.
- Correlation strength -- How many related alerts exist for the same attacker or target. Maximum 15.
- Vulnerability / exposure -- Whether the affected system is internet-facing or otherwise exposed. Maximum 10.
- Attack velocity -- How many related events occurred in a short time window. Maximum 10.
The formula at the bottom shows how the final score is derived from the raw score, adjusted by asset weight and pipeline stage.
Confidence -- /100
Three factors contribute to the confidence score:
- Evidence quality -- How strong and reliable the available evidence is. Maximum 40.
- Evidence coverage -- How much of the expected evidence was present. Maximum 30.
- Source reliability -- How trustworthy the contributing data sources are. Maximum 20.
A threshold note below the confidence factors explains the verdict logic -- for example, a risk score in the 60-79 range with confidence at or above 70 is classified as a confirmed true positive.
Contributing Evidence
Lists the specific signals that increased the AI's confidence in its verdict. Each item explains what was found and why it supports the conclusion.
Missing Evidence
Lists the information the AI did not have that would have strengthened or potentially changed its verdict. Use this as your investigation checklist -- these are the gaps worth looking into before making a final decision on the alert.
The scoring engine version and configuration version are shown at the bottom of the panel.
Toolbar actions
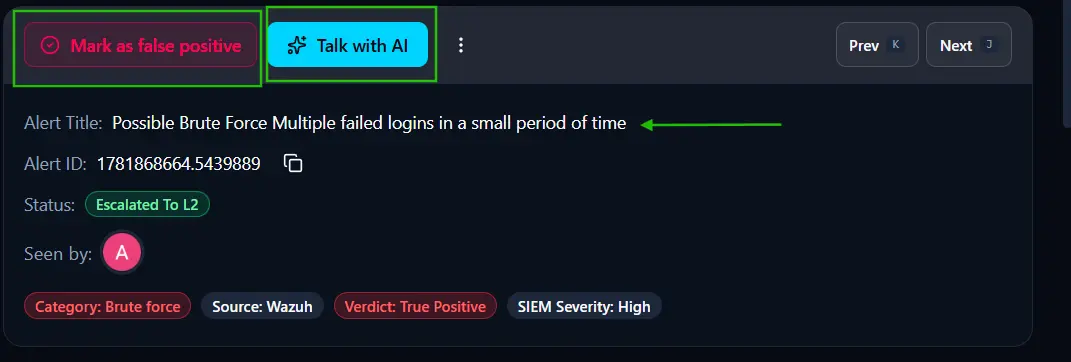
Mark as false positive (red) -- Closes the alert as confirmed benign and sends feedback to the AI. Only use when you are certain after reading the full analysis.
Talk with AI (teal) -- Opens the Copilot panel pre-loaded with context from this alert.
Overview Tab
The Overview tab contains the AI's complete investigation output. It is active by default.
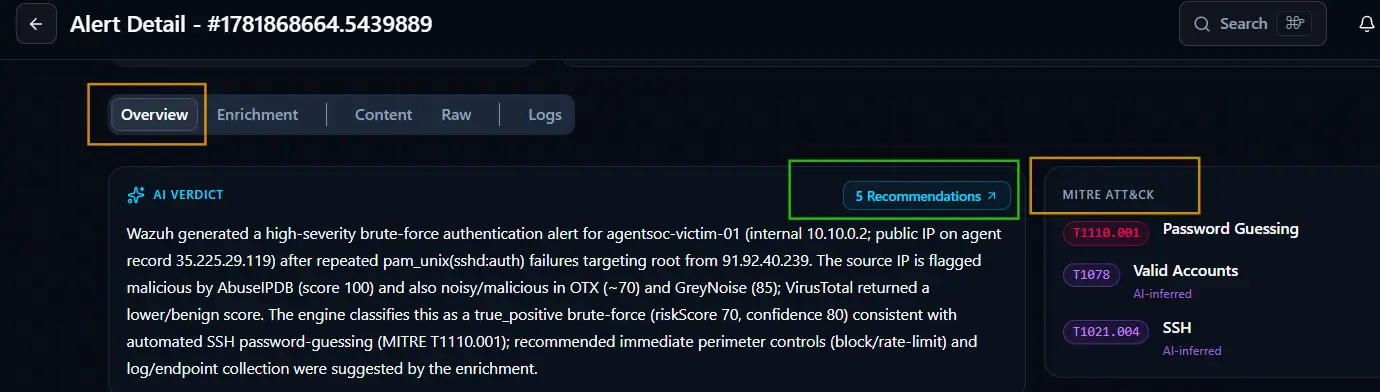
AI Verdict
A plain-language narrative written by the AI covering what was detected, what each threat intelligence provider returned, and why the risk score and verdict were assigned. Read this fully before taking any action on the alert.
The Recommendations button
Appears in the top right of the AI Verdict section. Click it to expand the AI's specific suggested next steps for this alert.
MITRE ATT&CK
Lists the MITRE ATT&CK technique IDs the AI matched to this alert. Each entry shows:
- Technique ID -- The unique MITRE identifier, for example T1110.001.
- Technique name -- The name of the attack technique, for example Password Guessing.
- Enrichment label -- Indicates whether the technique was confirmed by enrichment data or inferred by the AI. Techniques without a label were directly confirmed. Techniques labeled AI-inferred were identified by the AI based on behavioral patterns rather than direct evidence.
Click any technique ID to open its full description on the MITRE ATT&CK website.
Entities and SOAR response panel

Every system, user, and IP involved in this alert, each with its role: Attacker IP, Victim Host, or Targeted User. A Privileged badge marks accounts with elevated permissions. Find resource identifiers here when filling in AgentSOAR action forms.
SOAR Response
Actions -- What the AI did. Case created means a Case has been opened for human investigation. Click the link icon to go directly to that case.
Escalated -- Confirms whether the alert was escalated to a human analyst. Yes means a Case exists and is waiting in the Cases queue.
Attack Timeline
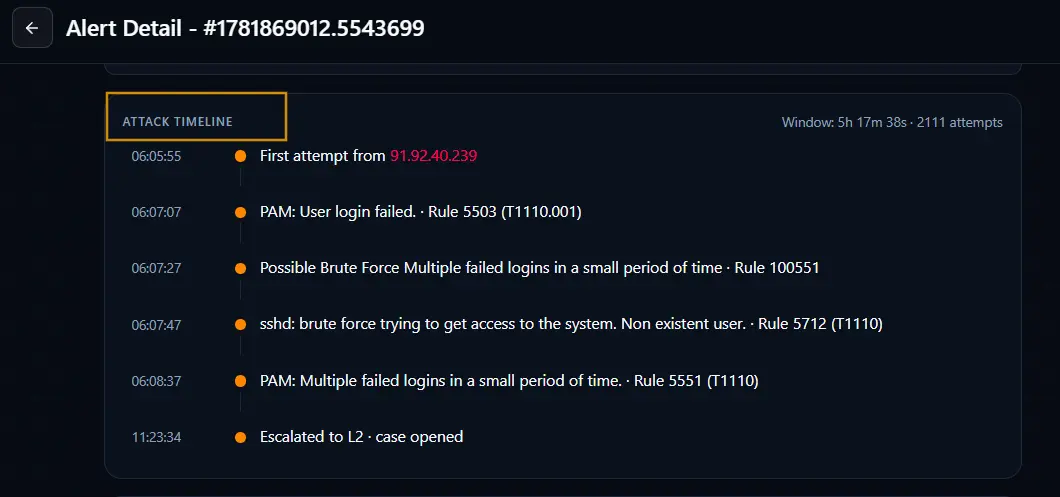
The Attack Timeline shows the chronological sequence of events that led to this alert. The header shows two values: the total time window from the first event to the last, and the total number of attempts recorded within that window.
Each row shows a timestamp and a description of what occurred at that moment, including the Wazuh rule that fired and its corresponding MITRE technique ID where applicable. The attacker IP address is highlighted in the timeline to make it easy to identify. The final entry shows when the alert was escalated and a case was opened.
The timeline is useful for understanding the pace and pattern of an attack. A short window with a high attempt count indicates a fast, automated attack. A long window with fewer attempts may indicate a slower, more deliberate approach designed to avoid detection thresholds.
Threat Intelligence and Blast Radius
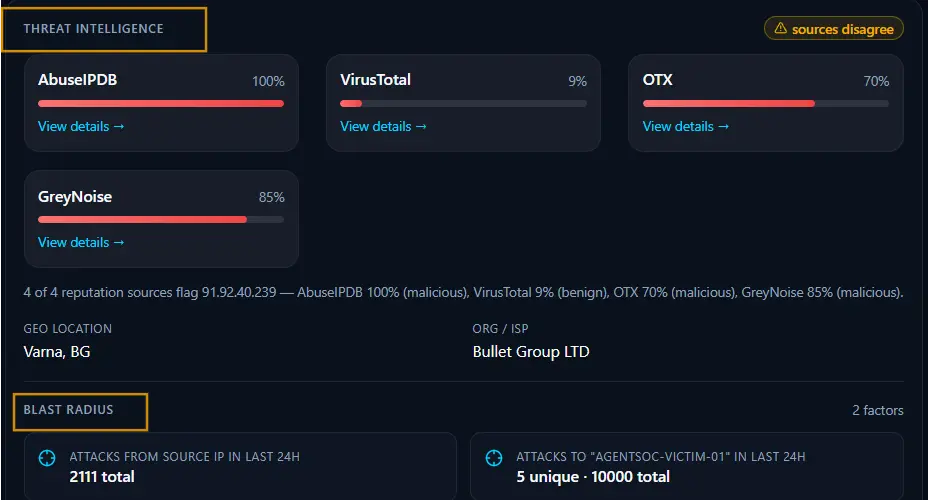
Shows the results from each threat intelligence provider that returned data for the observables in this alert. Each provider card displays the provider name, a malicious confidence percentage, a color-coded progress bar, and a View details link to see the full provider response.
A sources disagree badge appears in the top right when providers reach conflicting conclusions about the same observable. When this badge is present, review each provider's result individually rather than relying on a single source before making a decision.
Geo Location -- The country and city associated with the source IP address.
Org / ISP -- The organization or internet service provider that owns the IP address.
Blast Radius
Shows the broader reach of this threat beyond the single alert. The counter in the top right shows how many factors contribute to the blast radius assessment. Two panels are shown:
- Attacks from source IP in last 24h -- The total number of attacks originating from the attacker's IP address across your environment in the last 24 hours. A high number indicates the attacker is actively and broadly targeting your organization.
- Attacks to the victim host in last 24h -- The number of unique attack types and total attack attempts directed at the targeted host in the last 24 hours. A high number indicates the host is under sustained pressure from multiple attack vectors.
Enrichment Tab
The Enrichment tab shows the detailed output of the AI's classification and threat intelligence analysis for this alert.
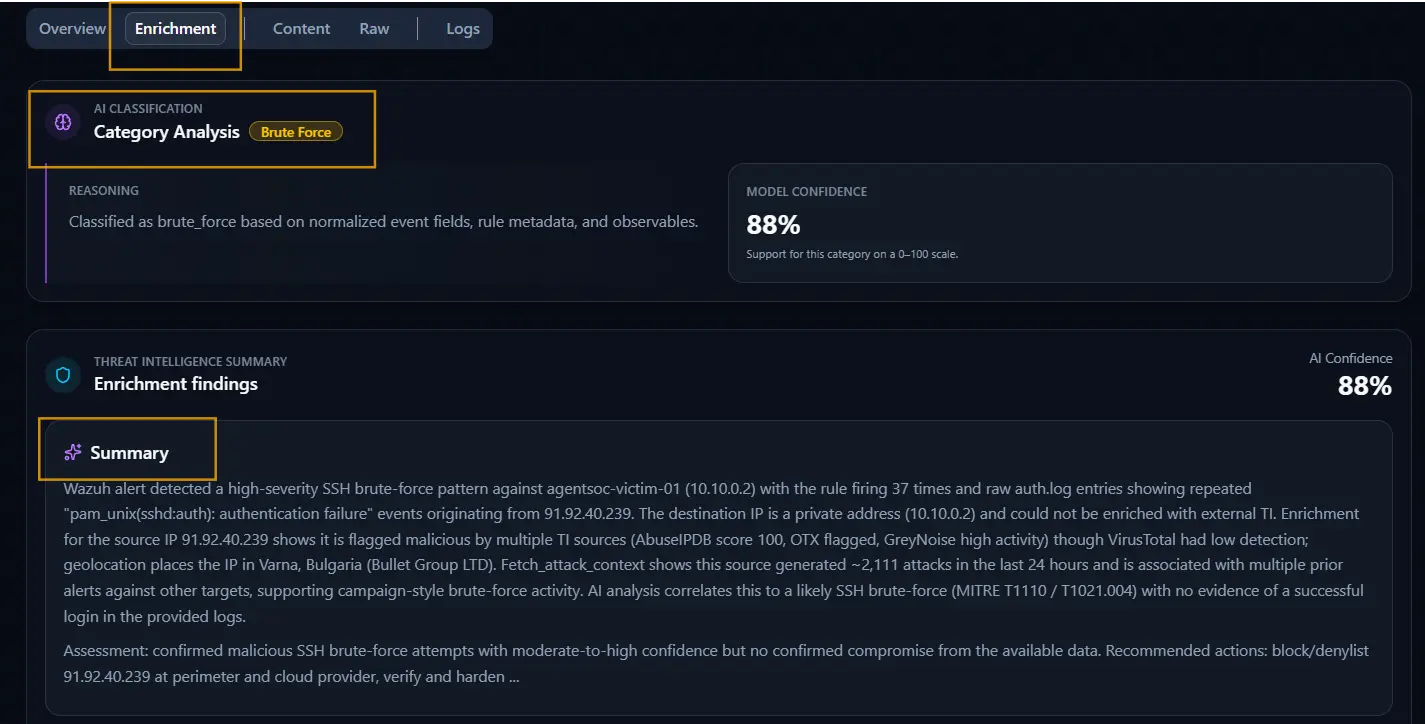
AI Classification
Shows how the AI categorized this alert. The category is displayed as a badge next to the Category Analysis heading.
- Reasoning -- A plain-language explanation of why the AI assigned this category, based on the normalized event fields, rule metadata, and observables extracted from the alert.
- Model Confidence -- How confident the AI is in its category assignment, on a scale of 0 to 100. A higher percentage means the AI had strong supporting evidence for this classification.
Threat Intelligence Summary
Shows the AI Confidence score for the overall enrichment findings in the top right. Below that, the Summary section contains a full narrative written by the AI covering:
- What the originating SIEM rule detected and how many times it fired.
- What the raw log entries showed.
- What each threat intelligence provider returned for the source IP, including reputation scores and geolocation.
- How much attack activity has been seen from the source IP in the last 24 hours.
- Which MITRE ATT&CK techniques the activity maps to.
- Whether a successful login or compromise was detected in the available logs.
- An assessment of the overall situation and recommended actions.
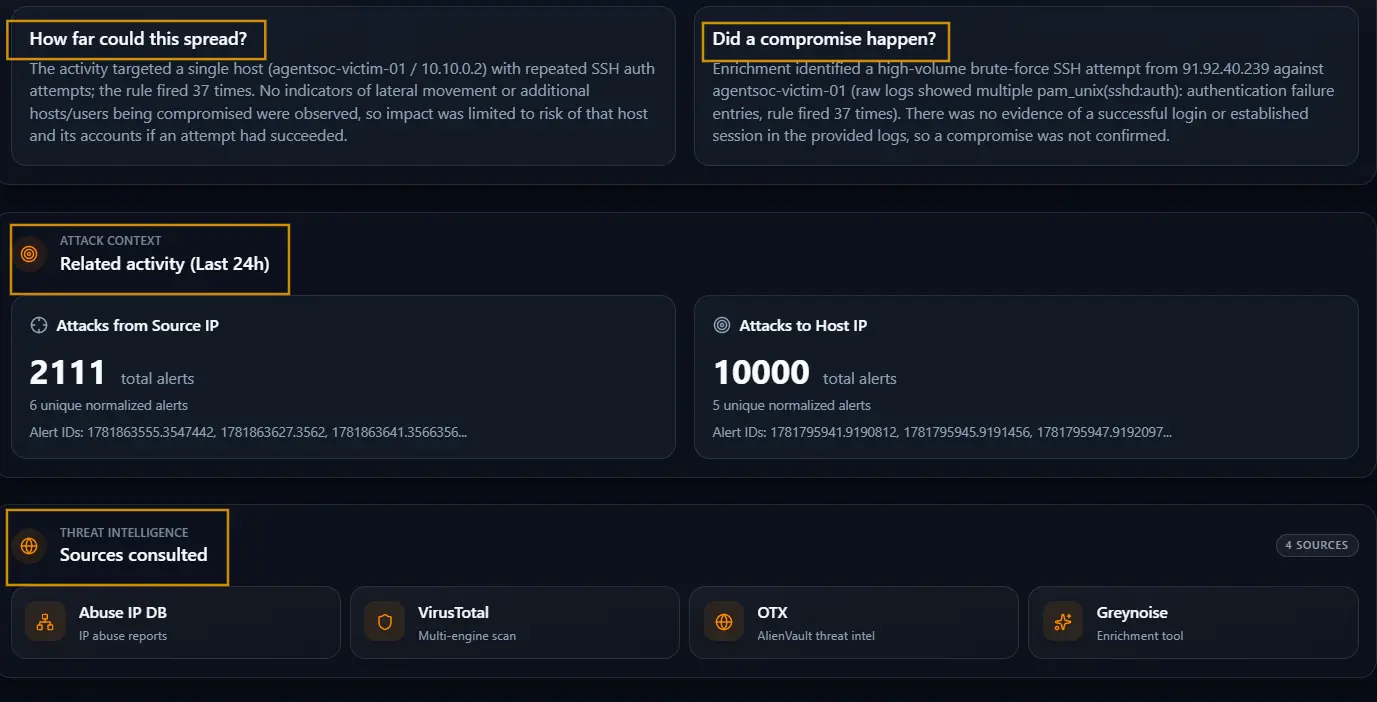
How far could this spread?
The AI's assessment of the potential impact if this threat were to succeed. It describes which hosts or accounts are at risk, whether any indicators of lateral movement were observed, and how contained or widespread the threat appears to be based on available evidence.
Did a compromise happen?
The AI's assessment of whether an actual compromise occurred. It describes what the logs showed, whether a successful login or established session was detected, and whether the evidence confirms or rules out a compromise. This helps prioritize urgency -- an unconfirmed compromise requires a different response than a confirmed one.
Attack Context
Shows how much related activity has been seen in the last 24 hours, split into two panels:
- Attacks from Source IP -- The total number of alerts and unique normalized alert types generated by the attacker's IP address across your environment in the last 24 hours. Also lists the related Alert IDs for direct reference.
- Attacks to Host IP -- The total number of alerts and unique normalized alert types targeting the victim host in the last 24 hours. Also lists the related Alert IDs.
Sources consulted
Lists which threat intelligence providers were queried during the enrichment of this alert. The counter in the top right shows the total number of sources consulted. Each provider card shows the provider name and the type of intelligence it provides -- for example IP abuse reports, multi-engine scanning, or geolocation enrichment.
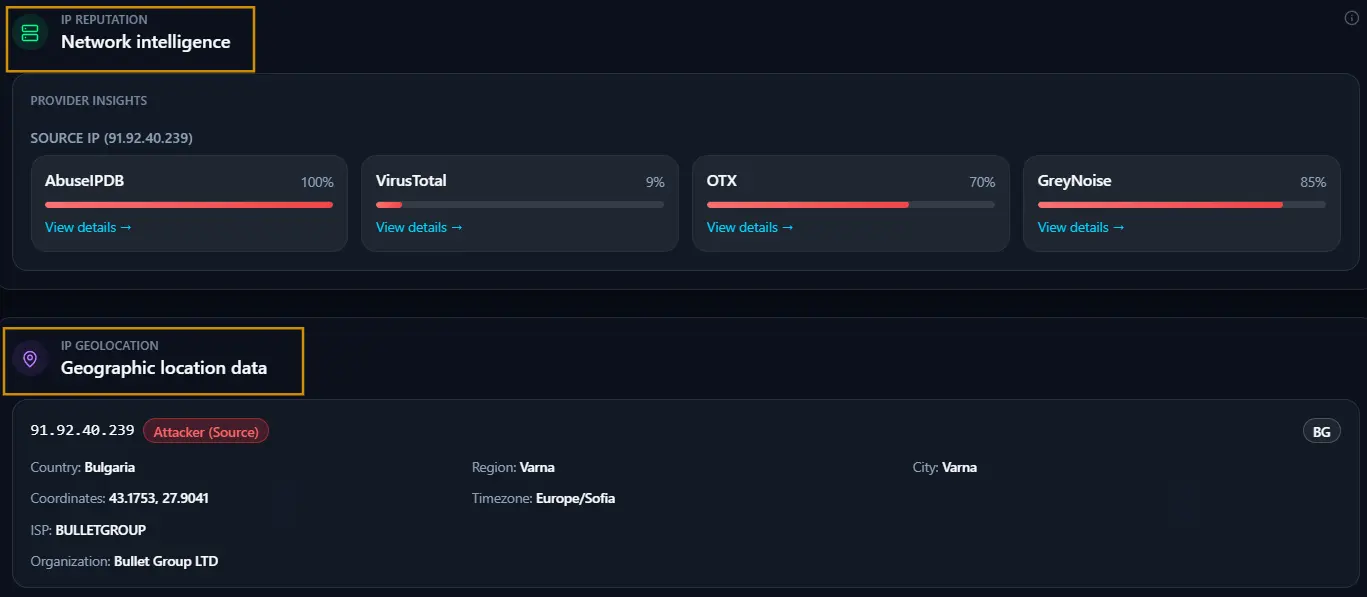
IP Reputation -- Network Intelligence
Shows the reputation results from each threat intelligence provider for the source IP identified in this alert.
Provider Insights
Displays the source IP address being assessed, followed by a card for each provider that returned data. Each card shows the provider name, a malicious confidence percentage, a color-coded progress bar, and a View details link to see the full raw response from that provider.
IP Geolocation -- Geographic Location Data
Shows the physical location and network ownership details for the IP address. Each entry is labeled with its role in the alert -- for example Attacker (Source) -- and a country code badge. The following fields are shown:
- Country -- The country the IP address is registered in.
- Region -- The region or state within that country.
- City -- The city associated with the IP address.
- Coordinates -- The latitude and longitude of the IP address location.
- Timezone -- The timezone of the IP address location.
- ISP -- The internet service provider that owns the IP address.
- Organization -- The organization registered to that IP address.
Content, Raw, and Logs Tabs
Content tab
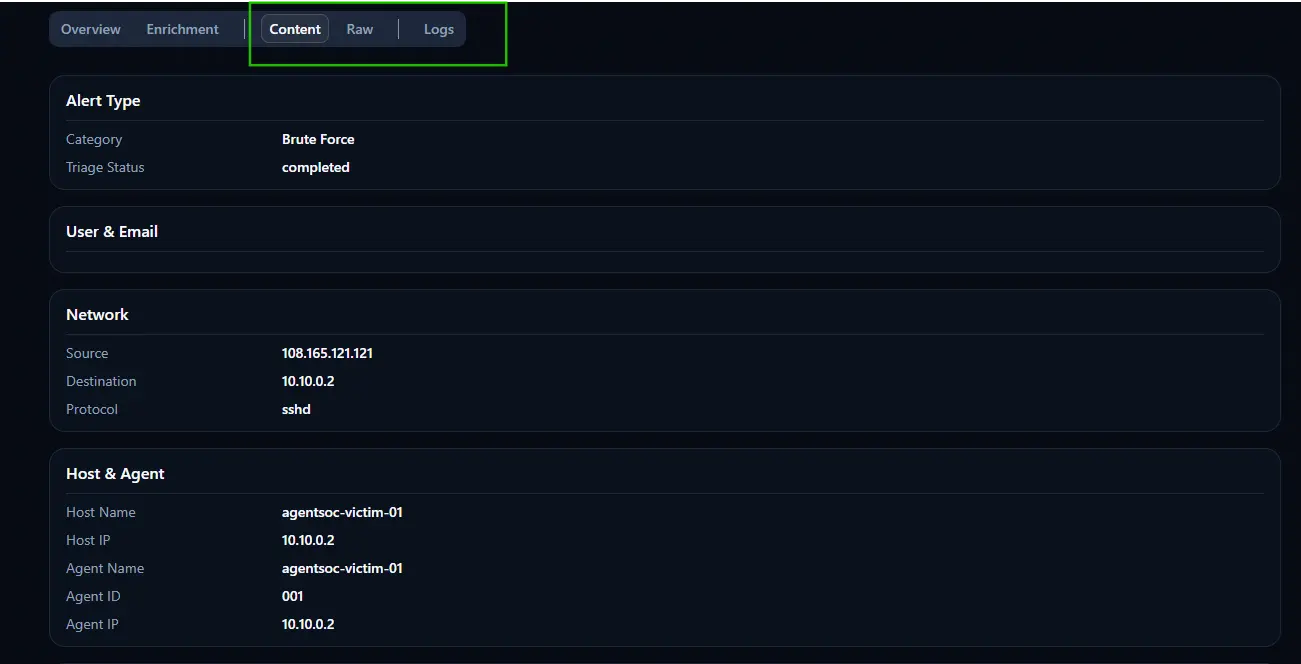
All structured data fields extracted from this alert in labeled sections: Alert Type, Alert Details, Host and Agent information, Network information, Rule Details from the originating SIEM, extracted Observables, the full Triage Decision block, and the Enrichment Summary. Use this when you need specific field values or want data to share with a colleague or Jutsu support.
Raw tab
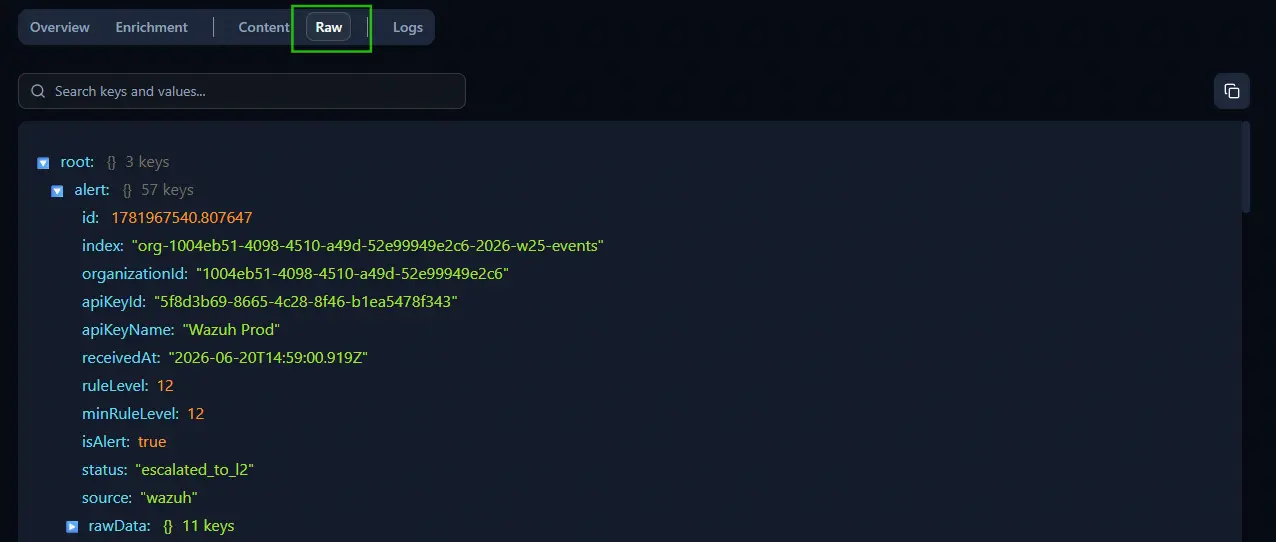
The complete JSON payload as Jutsu received it, before any processing. Use the search field to filter. Click Copy for the full JSON. Use this when verifying what the AI worked with, when an alert processed unexpectedly, or when Jutsu support asks for the original payload.
Logs tab
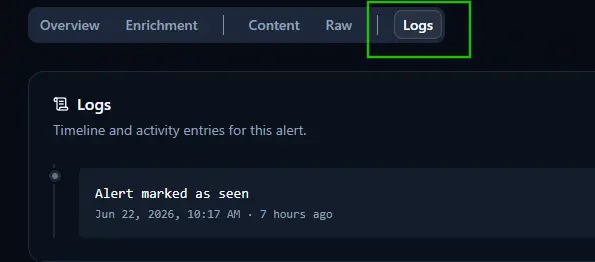
A timestamped log of every processing step the pipeline ran on this alert: enrichment start, triage decision, case creation. Use this when troubleshooting an alert that processed unexpectedly.
Copilot Panel
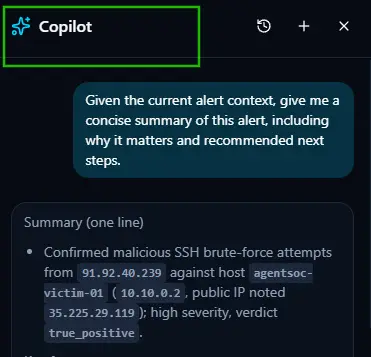
Click Talk with AI at the top of any Alert Detail to open the Copilot panel, pre-loaded with context from this specific alert.
- Click Talk with AI.
- Use 'Summarize this alert' for a plain-language breakdown.
- Use 'Investigate an IP in this alert' for IP reputation context.
- Or type your own question and click Send.
- Click the toggle to close the panel.
Copilot and verification: Copilot provides analysis based on available context. For high-stakes decisions, cross-reference its output against the underlying alert data and threat intelligence results in the platform.