Go Deeper -- Events
The Events Page
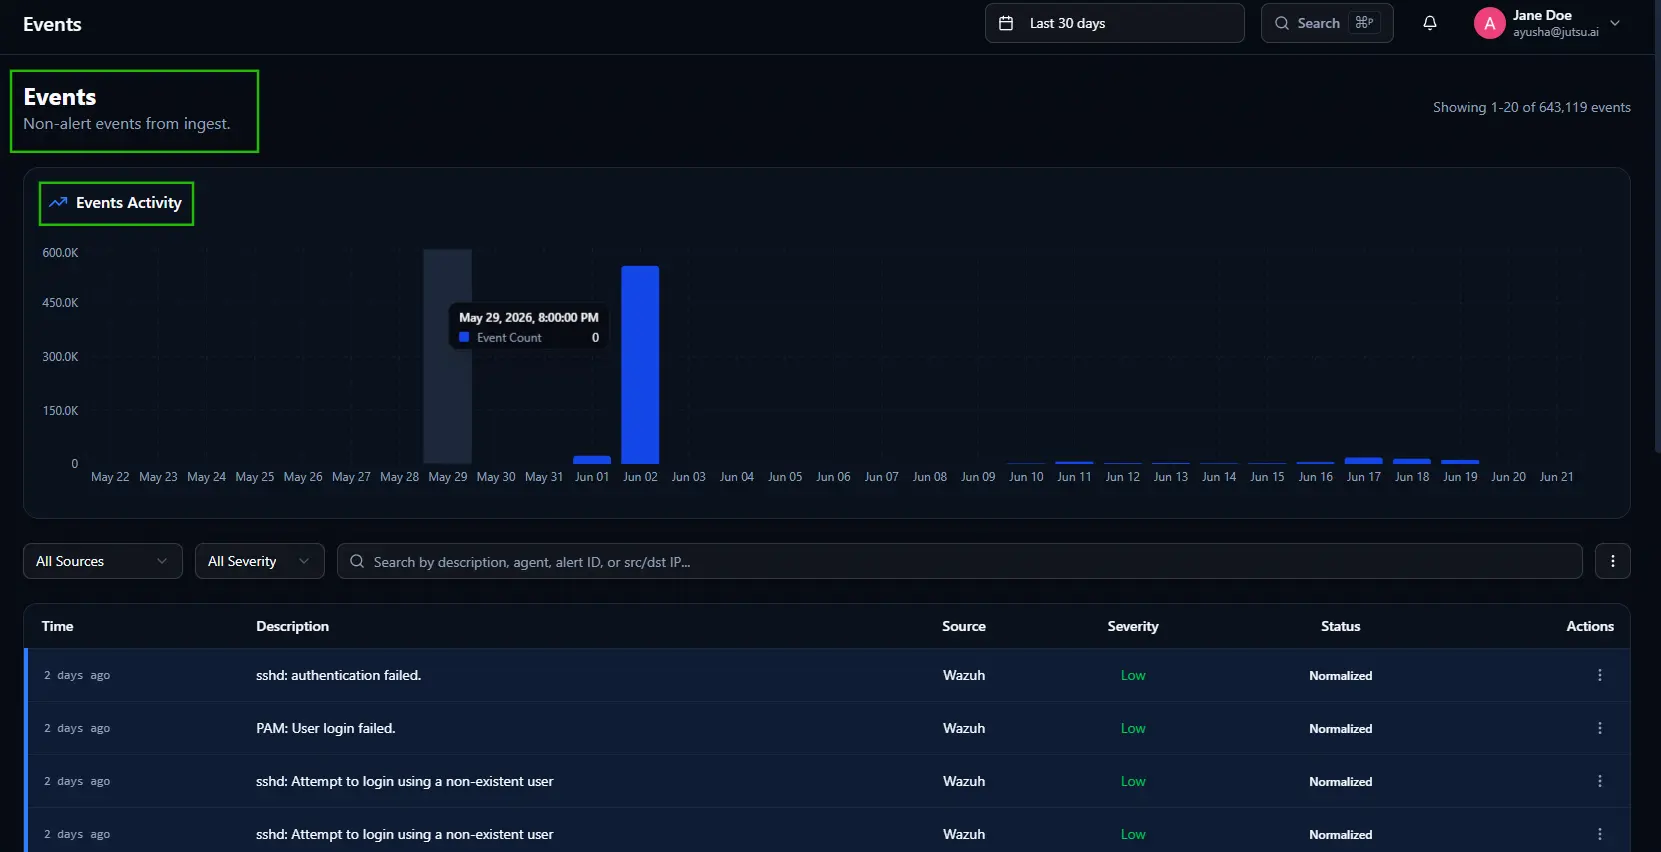
Events are the raw, non-alert log entries received directly from your connected data sources. Every login attempt, authentication failure, network connection, and system action is recorded here before any AI processing has run on it. The page header shows the total count of events in the current view. The page defaults to Last 24 hours.
Events Activity Chart
A bar chart showing event volume over time. Each bar represents a time interval. Hover over any bar to see the exact date, time, and event count for that interval. Spikes in volume indicate periods of high activity. Use the chart to identify when activity occurred before narrowing your search with the filters below.
Filters
- All Sources -- Filters events by data source. Options are Wazuh, Google Workspace Email Logs, and Syslog.
- All Severity -- Filters by the severity level assigned by the originating tool.
- Search -- Searches across event descriptions, agent names, alert IDs, and source or destination IP addresses.
- Three-dot menu -- Contains the Clear org SIEM indices option, which permanently wipes all ingested event data for your organization. Only use this if Jutsu support explicitly instructs you to.
Events Table
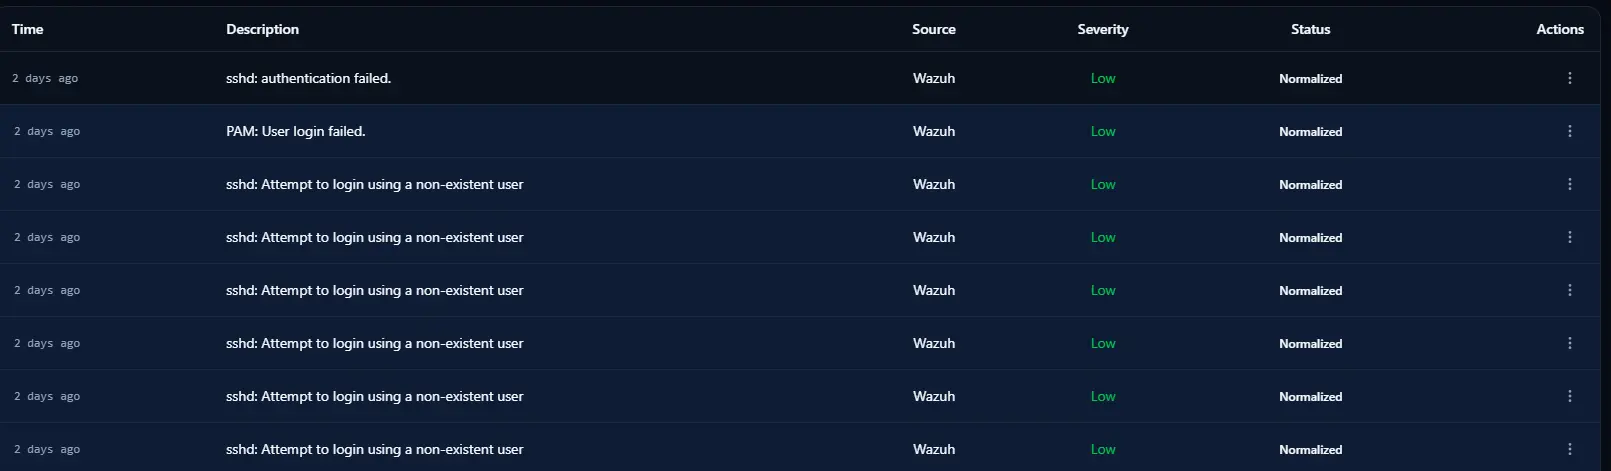
Each row represents one raw event. The columns are:
- Time -- How long ago the event was received.
- Description -- A plain-language description of the event.
- Source -- The data source that generated the event.
- Severity -- The severity level assigned by the originating tool.
- Status -- The current processing status of the event. Normalized means the event has been processed by the Normalizer agent and is ready for further pipeline steps.
- Actions -- The three-dot menu on each row contains event-level actions for that specific entry.
Events at scale: Never try to review events manually without filtering first. If you are investigating a specific alert, start from the Alert Detail Attack Timeline -- it already shows the relevant events in chronological order.
Path: Investigations > Events.
Inside an event
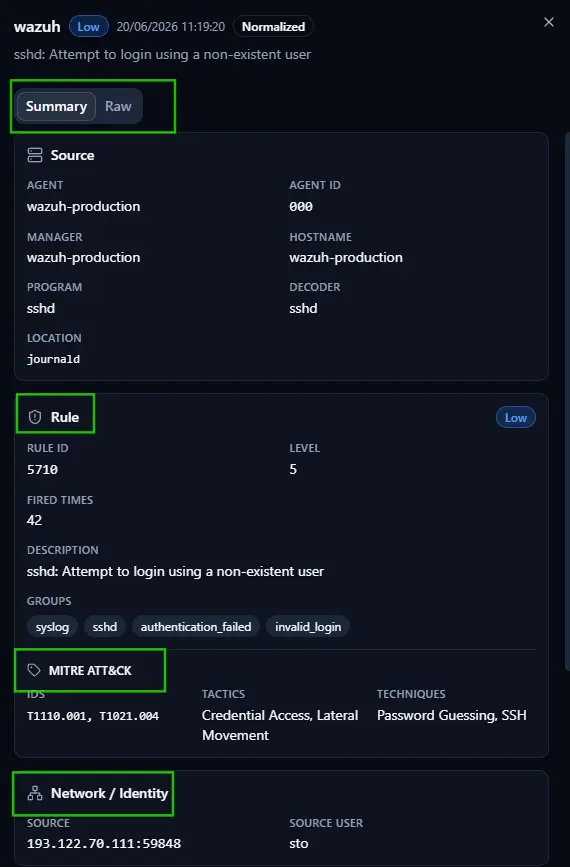
Two tabs are available: Summary and Raw.
Summary Tab
Displays the structured fields extracted from this event, organized into three sections.
Source
Details about the agent and system that generated this event:
- Agent -- The name of the Wazuh agent that collected this event.
- Agent ID -- The unique identifier of the agent.
- Manager -- The Wazuh manager that received the event from the agent.
- Hostname -- The hostname of the system where the event originated.
- Program -- The program or service that generated the log entry.
- Decoder -- The Wazuh decoder used to parse this event.
- Location -- The log file or journal source the event came from.
Rule
Details about the Wazuh rule that matched this event:
- Rule ID -- The unique identifier of the matching rule.
- Level -- The rule's severity level on the Wazuh scale.
- Fired Times -- How many times this rule has fired across the dataset.
- Description -- A plain-language description of what the rule detected.
- Groups -- The rule group tags assigned to this rule.
- MITRE ATT&CK -- The MITRE technique IDs, tactics, and technique names mapped to this rule.
Network / Identity
Network and identity observables extracted from this event:
- Source -- The source IP address and port the activity originated from.
- Source User -- The username associated with the activity.
Raw Tab
Shows the complete, unprocessed JSON payload of this event exactly as it was received from the source. Use this when you need to verify the original log data or when Jutsu support asks for the raw event payload.