See the Full Campaign -- Incidents
An incident is what happens when the AI's Incident Correlation engine detects that multiple alerts belong to the same attack campaign. A single alert is one data point. An incident shows the complete picture: every related event grouped together, the full attacker timeline, all affected systems, and the AI's campaign-level analysis. One attacker running a distributed brute-force campaign across multiple hosts might generate 50 individual alerts -- those become one incident.
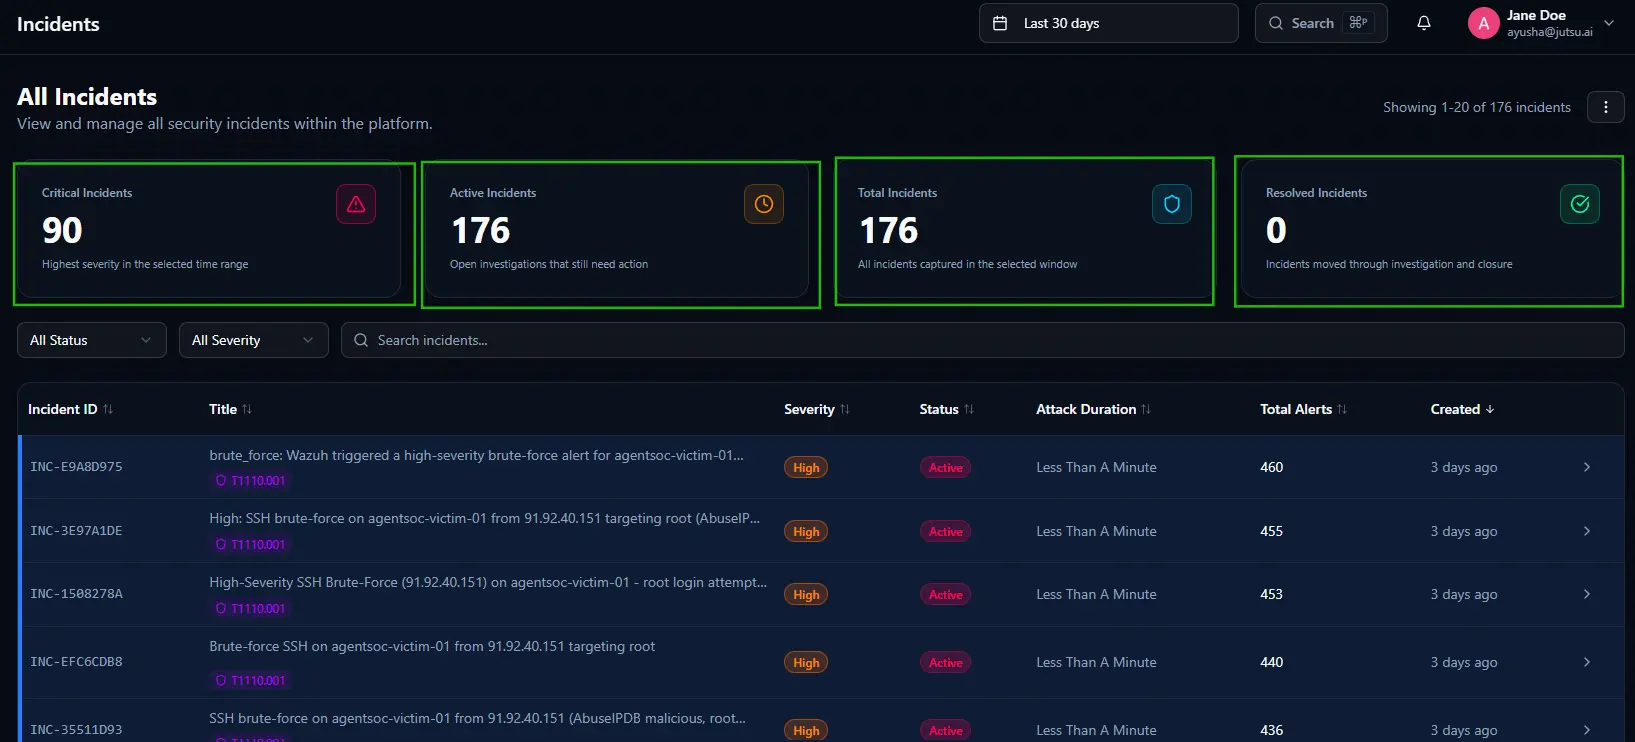
Path: Incidents in the left sidebar. The page defaults to Last 30 days. Expand the time range if you want to see a longer history.
The Incidents List
Summary cards
Critical Incidents -- The number of critical-severity incidents in the selected time range.
Active Incidents -- Open incidents that still need action. These are investigations in progress.
Total Incidents -- All incidents captured in the selected time window, regardless of status.
Resolved Incidents -- Incidents that have been moved through investigation and closure.
Filters
All Status -- Filters incidents by their current state. Options are Active, Resolved, and Closed.
All Severity -- Filters by severity level. Options are Critical, High, Medium, Low, and Info.
Search -- Free-text search across incident titles.
Reading the table
Incident ID is the unique identifier. Title is the AI-generated campaign name. Severity reflects the highest severity among all constituent alerts. Attack Duration is the time from the first alert to the last -- long duration means the threat was active for a while and may have established persistence. Total Alerts shows how many individual alerts were grouped together.
How to prioritize
Look at Total Alerts first -- a high number means the attacker has hit many systems. Then check Attack Duration -- long duration suggests potential persistence. Work Critical and High severity incidents first.
Cases and incidents are independent: Resolving a Case does not close the Incident it belongs to. Incidents are managed separately and stay active until explicitly closed, even after all constituent Cases are resolved.
Incident Detail and the Security Incident Report
Click any incident row to open the Incident Detail.
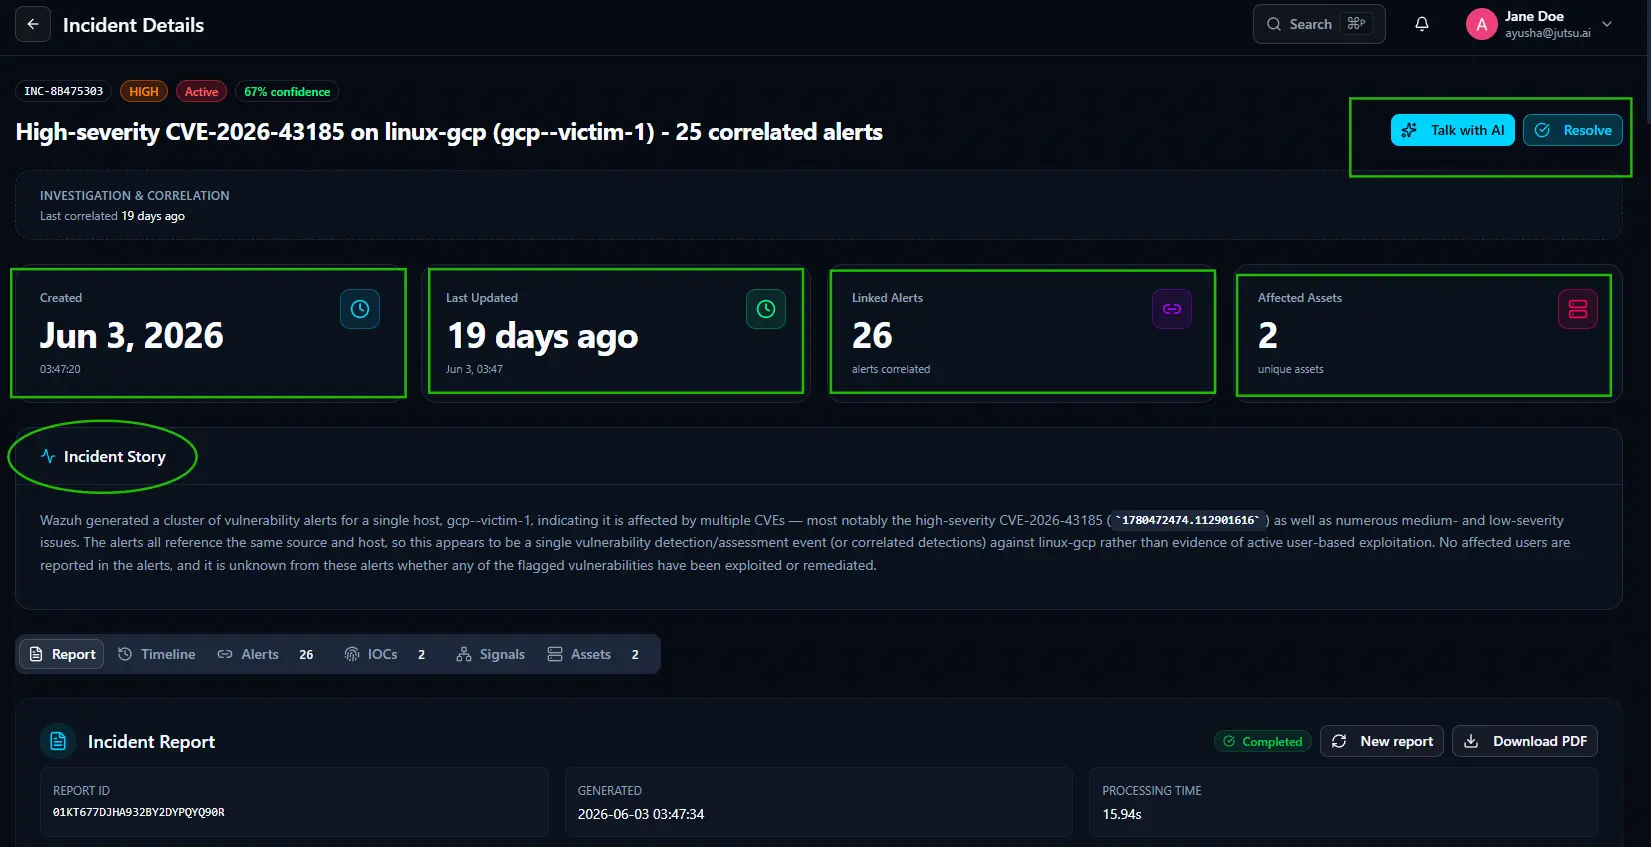
Investigation & Correlation
Shows when the incident was last correlated -- meaning when the AI last checked for new related alerts and added them to this incident.
Summary cards
- Created -- The date and time this incident was first generated, including the exact timestamp.
- Last Updated -- How long ago the incident was last updated with new information.
- Linked Alerts -- The total number of individual alerts correlated into this incident.
- Affected Assets -- The number of unique assets involved across all correlated alerts.
Incident Story
A plain-language narrative written by the AI describing what happened, why the alerts were grouped together, what the likely attack vector is, and what is currently known or unknown about the campaign. Read this first before reviewing individual alerts or the report -- it gives you the strategic context for the entire incident.
Tabs
- Report -- The primary working tab. Contains the full Security Incident Report including the executive summary, next steps, correlation analysis, and audit trail. Active by default.
- Timeline -- A chronological log of every event and action in this incident from first detection through each investigation step.
- Alerts -- The complete list of correlated alerts with their count shown on the tab. Click any alert to open its Alert Detail.
- IOCs -- All Indicators of Compromise extracted across all constituent alerts, with the count shown on the tab.
- Signals -- The detection signals and correlation evidence the AI used to group these alerts together.
- Assets -- The affected assets involved in this incident, with the count shown on the tab.
Talk with AI -- Opens the Copilot panel on the right side of the screen, pre-loaded with context from this specific incident. Use it to ask questions about the campaign, get a plain-language summary, or request suggested next steps without leaving the incident page.
Resolve -- Marks the incident as resolved and closes it. This action is separate from resolving individual Cases linked to this incident -- resolving an incident does not automatically resolve its Cases, and resolving Cases does not automatically resolve the incident. Both must be closed independently.
Report Tab : The Security Incident Report
Click the Report tab. This is the most complete view of the campaign.
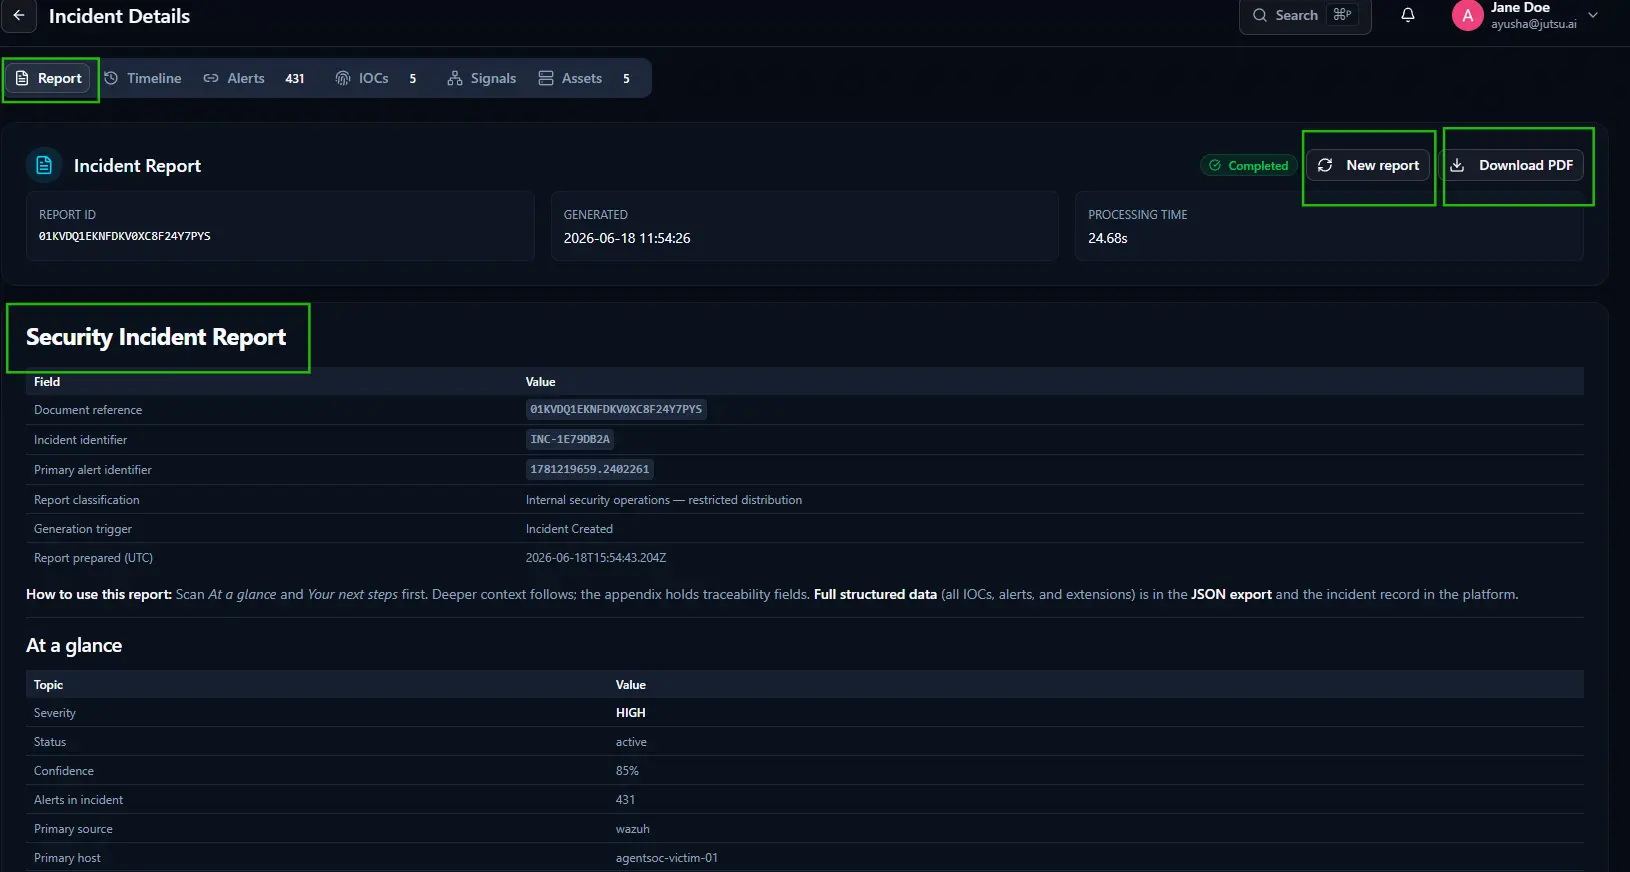
The Security Incident Report is automatically generated for every incident. It provides a structured, formal record of the campaign that can be used for internal review, compliance, or sharing with stakeholders.
The report header shows three fields:
- Report ID -- The unique identifier for this specific report generation.
- Generated -- The exact date and time the report was generated.
- Processing Time -- How long the report took to generate.
Three buttons sit in the top right:
- Completed badge -- Confirms the report has finished generating and is ready to read or download.
- New report -- Regenerates the report using the latest incident data. Use this if new alerts have been added to the incident since the last generation.
- Download PDF -- Downloads a formatted PDF of the full report suitable for sharing with stakeholders who do not have platform access.
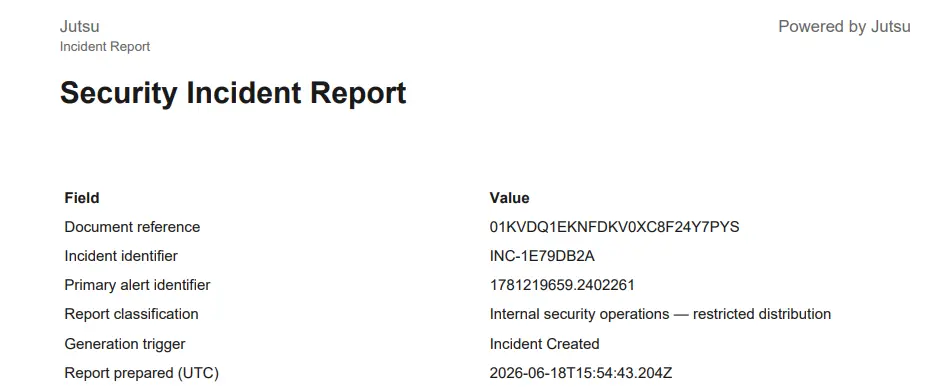
Report metadata table
A structured table at the top of the report containing reference fields:
- Document reference -- The unique document ID for this report.
- Incident identifier -- The incident ID this report belongs to.
- Primary alert identifier -- The ID of the anchor alert that triggered the incident.
- Report classification -- The distribution classification of this report. Internal security operations -- restricted distribution means it is intended for internal use only.
- Generation trigger -- What caused this report to be generated, for example Incident Created.
- Report prepared (UTC) -- The exact UTC timestamp of when the report was prepared.
A usage note below the table explains how to navigate the report: scan At a glance and Your next steps first, then read deeper context in the sections that follow. Full structured data including all IOCs, alerts, and extensions is available in the JSON export and in the incident record in the platform.
At a glance
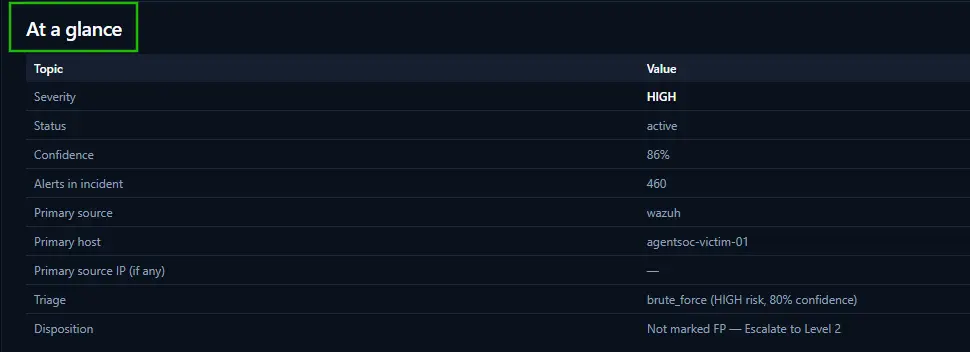
A concise summary table of the most important facts about this incident:
- Severity -- The overall severity level of the incident.
- Status -- The current state of the incident.
- Confidence -- The AI's confidence level in its overall assessment of the campaign.
- Alerts in incident -- The total number of correlated alerts included in this incident.
- Primary source -- The data source that generated the majority of alerts in this incident.
- Primary host -- The main internal asset targeted in this campaign.
Executive Summary
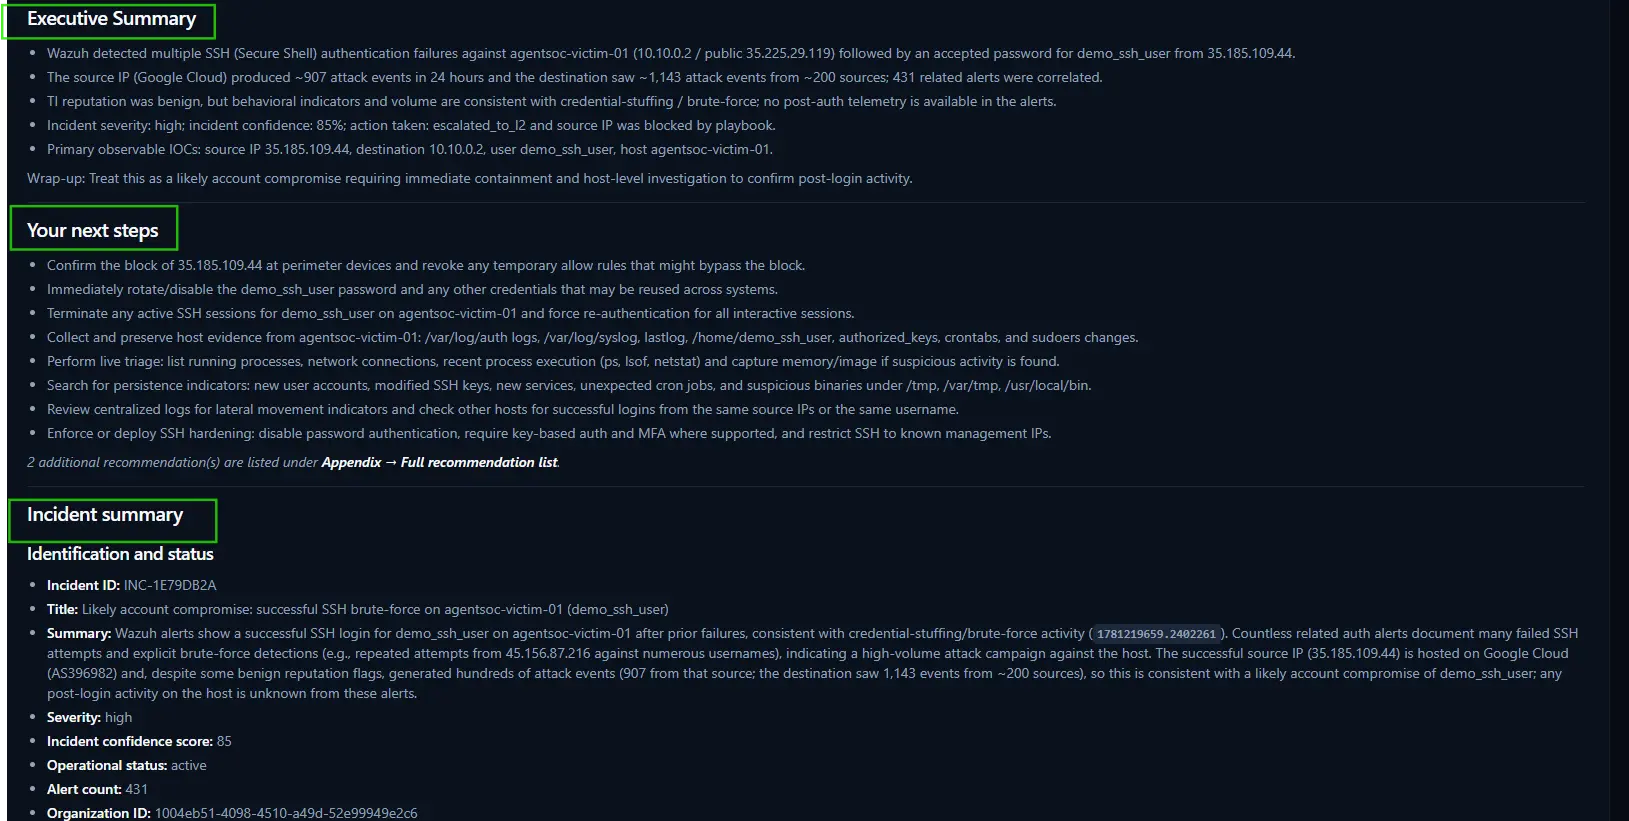
A bullet-point summary of the key findings across the entire incident. Covers what was detected, the volume of activity, threat intelligence results, the severity and confidence level, what automated actions were taken, and the primary IOCs involved. A wrap-up line at the bottom gives the AI's overall assessment and recommended immediate action.
Your Next Steps
A prioritized list of specific remediation and investigation actions the AI recommends based on the findings. These are ordered by urgency and cover containment, credential management, forensic evidence collection, live triage steps, persistence indicator checks, lateral movement review, and hardening recommendations. Additional recommendations beyond the main list are linked under Appendix -- Full recommendation list at the bottom of this section.
Incident Summary
A deeper narrative section covering the full context of the incident.
Identification and status
A structured list of key incident fields:
- Incident ID -- The unique identifier for this incident.
- Title -- The AI-generated name describing the campaign.
- Summary -- A detailed plain-language narrative of what happened, what the alerts showed, what the source IP activity looked like, and what is currently known or unknown about the outcome.
- Severity -- The overall severity level of the incident.
- Incident confidence score -- The AI's confidence in its overall assessment of the campaign.
- Operational status -- The current state of the incident.
- Alert count -- The total number of alerts correlated into this incident.
- Organization ID -- The unique identifier of the organization this incident belongs to.
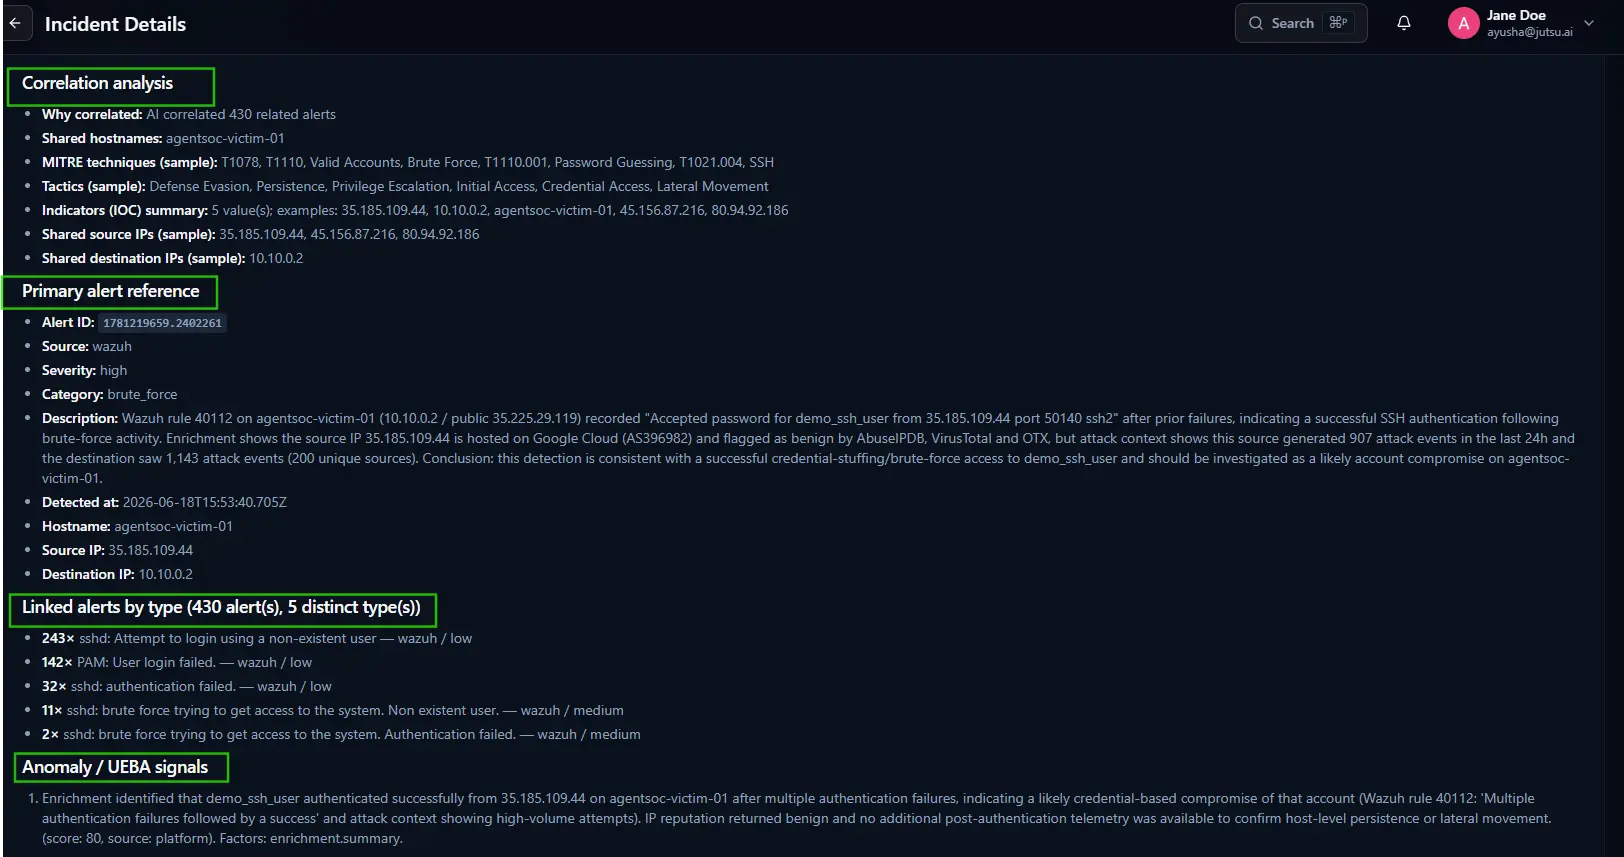
Correlation Analysis
Explains how and why the AI grouped these alerts into a single incident. Contains the following fields:
- Why correlated -- The total number of related alerts the AI grouped together and the reason for correlation.
- Shared hostnames -- The internal hostnames that appear across multiple alerts in this incident.
- MITRE techniques (sample) -- A sample of the MITRE technique IDs and names identified across the correlated alerts.
- Tactics (sample) -- A sample of the MITRE tactics observed across the incident.
- Indicators (IOC) summary -- The total number of unique IOC values found, with examples listed.
- Shared source IPs (sample) -- The external IP addresses that appear across multiple alerts in this incident.
- Shared destination IPs (sample) -- The internal IP addresses targeted across multiple alerts.
Primary Alert Reference
Details of the anchor alert the AI used as the starting point for this incident. Contains the following fields:
- Alert ID -- The unique identifier of the primary alert.
- Source -- The data source that generated the primary alert.
- Severity -- The severity level of the primary alert.
- Category -- The attack category of the primary alert.
- Description -- A full narrative of what the primary alert detected, what enrichment showed, and what conclusion the AI reached.
- Detected at -- The exact UTC timestamp of when the primary alert was generated.
- Hostname -- The internal host targeted in the primary alert.
- Source IP -- The external IP address the attack originated from.
- Destination IP -- The internal IP address that was targeted.
Linked Alerts by Type
A breakdown of all correlated alerts and events grouped by alert type, showing how many times each alert type fired and its source and severity. This gives a clear picture of the composition of the incident -- which detection rules fired most frequently and at what severity level.
Anomaly / UEBA Signals
User and Entity Behavior Analytics signals identified during enrichment. These are behavioral anomalies that go beyond standard rule-based detections -- for example, a user successfully authenticating after a high volume of failed attempts, which may indicate a credential-based compromise. Each signal includes a confidence score, the source of the signal, and the contributing factors.
Incident and Processing Timeline
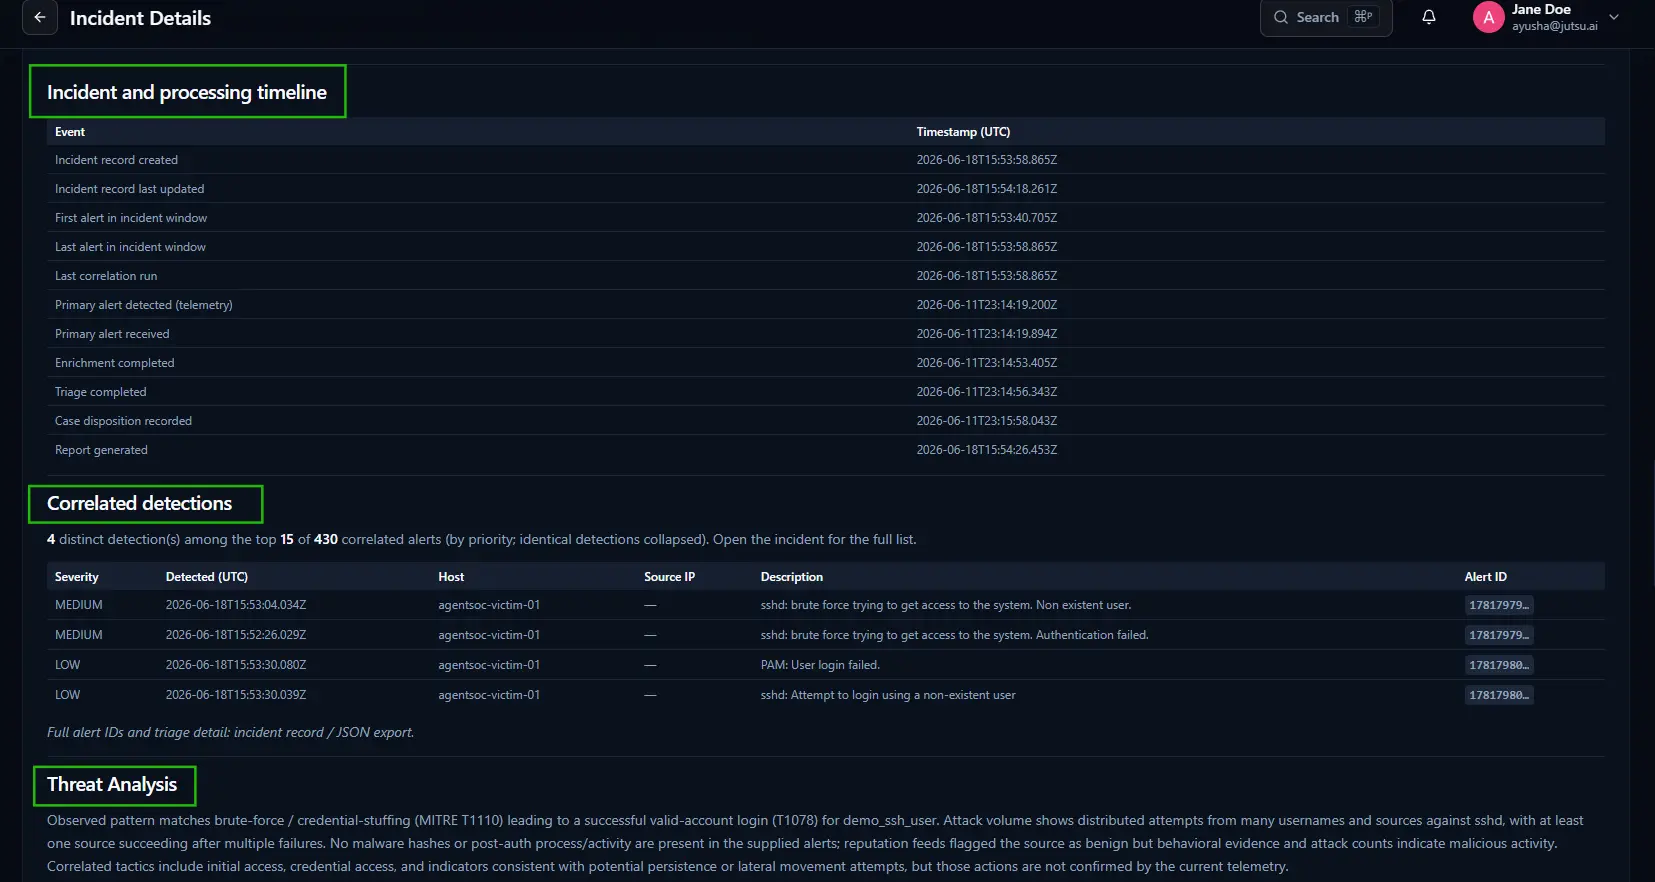
A timestamped audit trail of every processing step the AI pipeline ran on this incident, in chronological order. Each row shows an event name and its exact UTC timestamp. The events covered include:
- Incident record created -- When the incident was first generated.
- Incident record last updated -- When the incident was most recently updated.
- First alert in incident window -- When the earliest correlated alert was detected.
- Last alert in incident window -- When the most recent correlated alert was detected.
- Last correlation run -- When the AI last checked for new related alerts to add to this incident.
- Primary alert detected (telemetry) -- When the primary anchor alert was first observed at the source.
- Primary alert received -- When Jutsu/AgentSOC received the primary alert.
- Enrichment completed -- When the threat intelligence lookups finished for the primary alert.
- Triage completed -- When the AI finished scoring and classifying the primary alert.
- Case disposition recorded -- When the routing decision was made and recorded.
- Report generated -- When the Security Incident Report was generated.
This timeline provides full traceability for compliance and post-incident review purposes.
Correlated Detections
A sample table of the top correlated alerts grouped into this incident, ordered by priority. Identical detections are collapsed to avoid repetition. The header shows how many distinct detection types are represented in the sample and the total number of correlated alerts. A note at the bottom directs you to the full alert list in the incident record or JSON export for complete details. Each row shows:
- Severity -- The severity level of the detection.
- Detected (UTC) -- The exact timestamp of the detection.
- Host -- The internal host targeted.
- Source IP -- The external IP address involved, if available.
- Description -- A plain-language description of what was detected.
- Alert ID -- The unique identifier of the alert, truncated for display.
Threat Analysis
A narrative section where the AI describes the overall attack pattern observed across the incident. It covers which MITRE techniques were identified, what the behavioral evidence shows, whether any post-exploitation activity was detected, what reputation data returned, and which tactics are confirmed versus suspected based on available telemetry.
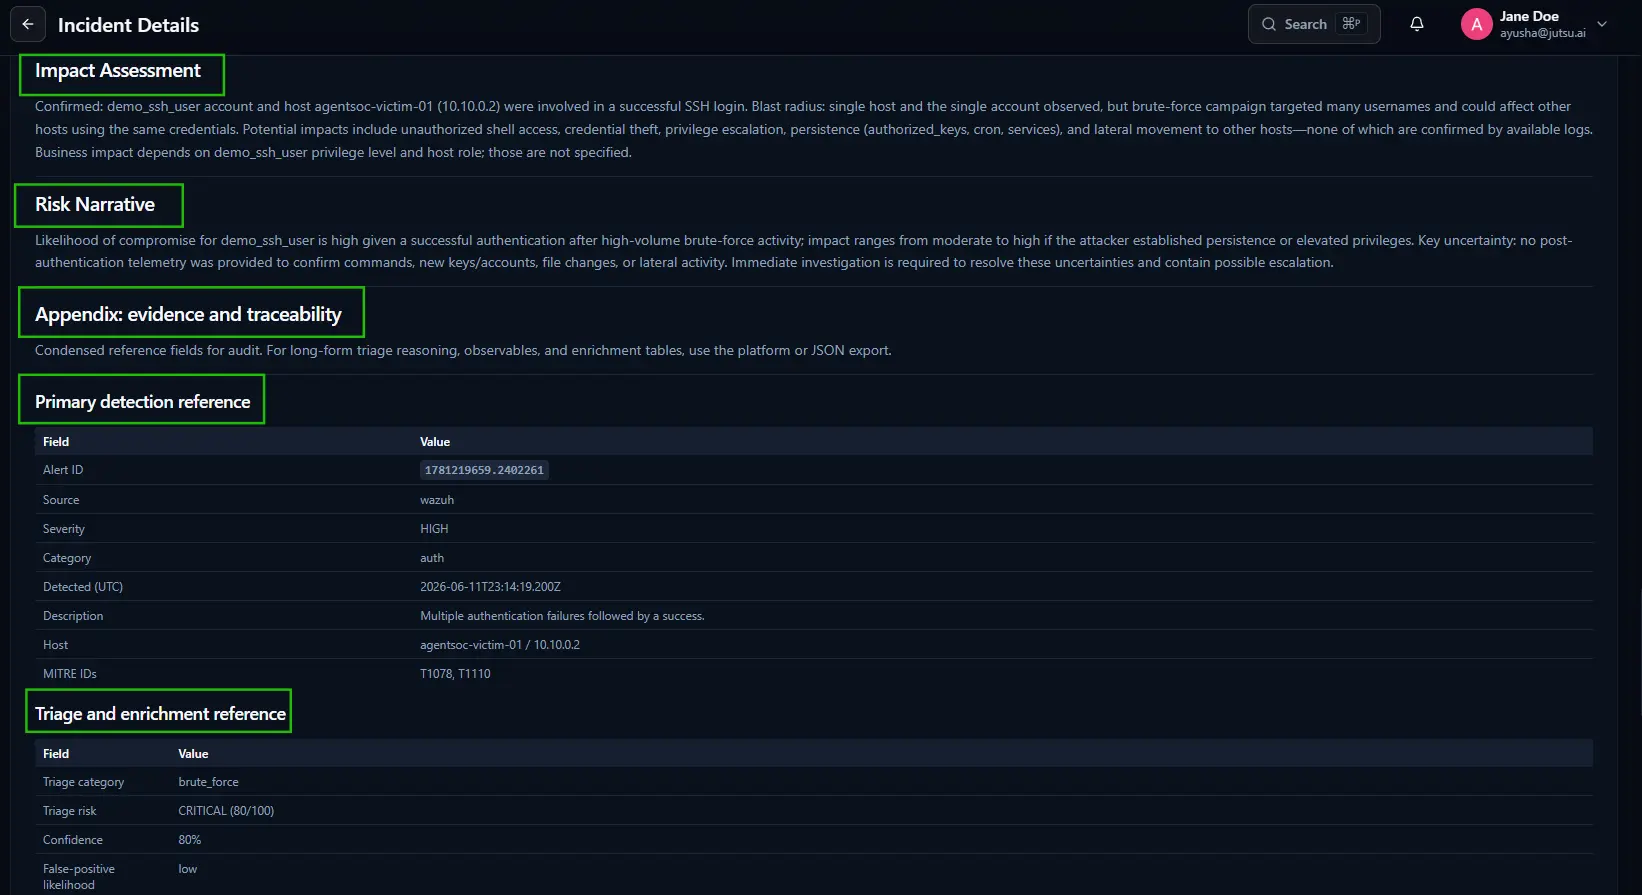
Impact Assessment
The AI's assessment of the confirmed and potential impact of this incident. Covers which accounts and hosts were directly involved, what the blast radius could be across the broader environment, what types of unauthorized activity could have occurred, and what business impact depends on factors not yet confirmed -- such as the privilege level of the affected account or the role of the targeted host.
Risk Narrative
A concise summary of the overall risk level, the key uncertainties in the investigation, and what immediate actions are required to resolve those uncertainties. This section is designed to be shared with a team lead or manager to convey the urgency and current state of the investigation without requiring them to read the full report.
Appendix: Evidence and Traceability
Condensed reference fields for audit purposes. The note at the top explains that for long-form triage reasoning, observables, and enrichment tables, the full data is available in the platform or via JSON export.
Primary Detection Reference
A structured table of the key fields from the anchor alert used to create this incident:
- Alert ID -- The unique identifier of the primary alert.
- Source -- The data source that generated it.
- Severity -- The severity level assigned.
- Category -- The attack category.
- Detected (UTC) -- The exact timestamp of detection.
- Description -- A plain-language description of what was detected.
- Host -- The hostname and internal IP address of the targeted system.
- MITRE IDs -- The MITRE technique IDs mapped to this alert.
Triage and Enrichment Reference
A structured table of the AI's triage and scoring output for the primary alert:
- Triage category -- The attack category assigned during triage.
- Triage risk -- The risk score and severity label assigned during triage.
- Confidence -- The AI's confidence level in its triage verdict.
- False-positive likelihood -- The AI's assessment of how likely this alert is to be a false positive.
Case Disposition
Documents the final routing decision the AI made for this incident.
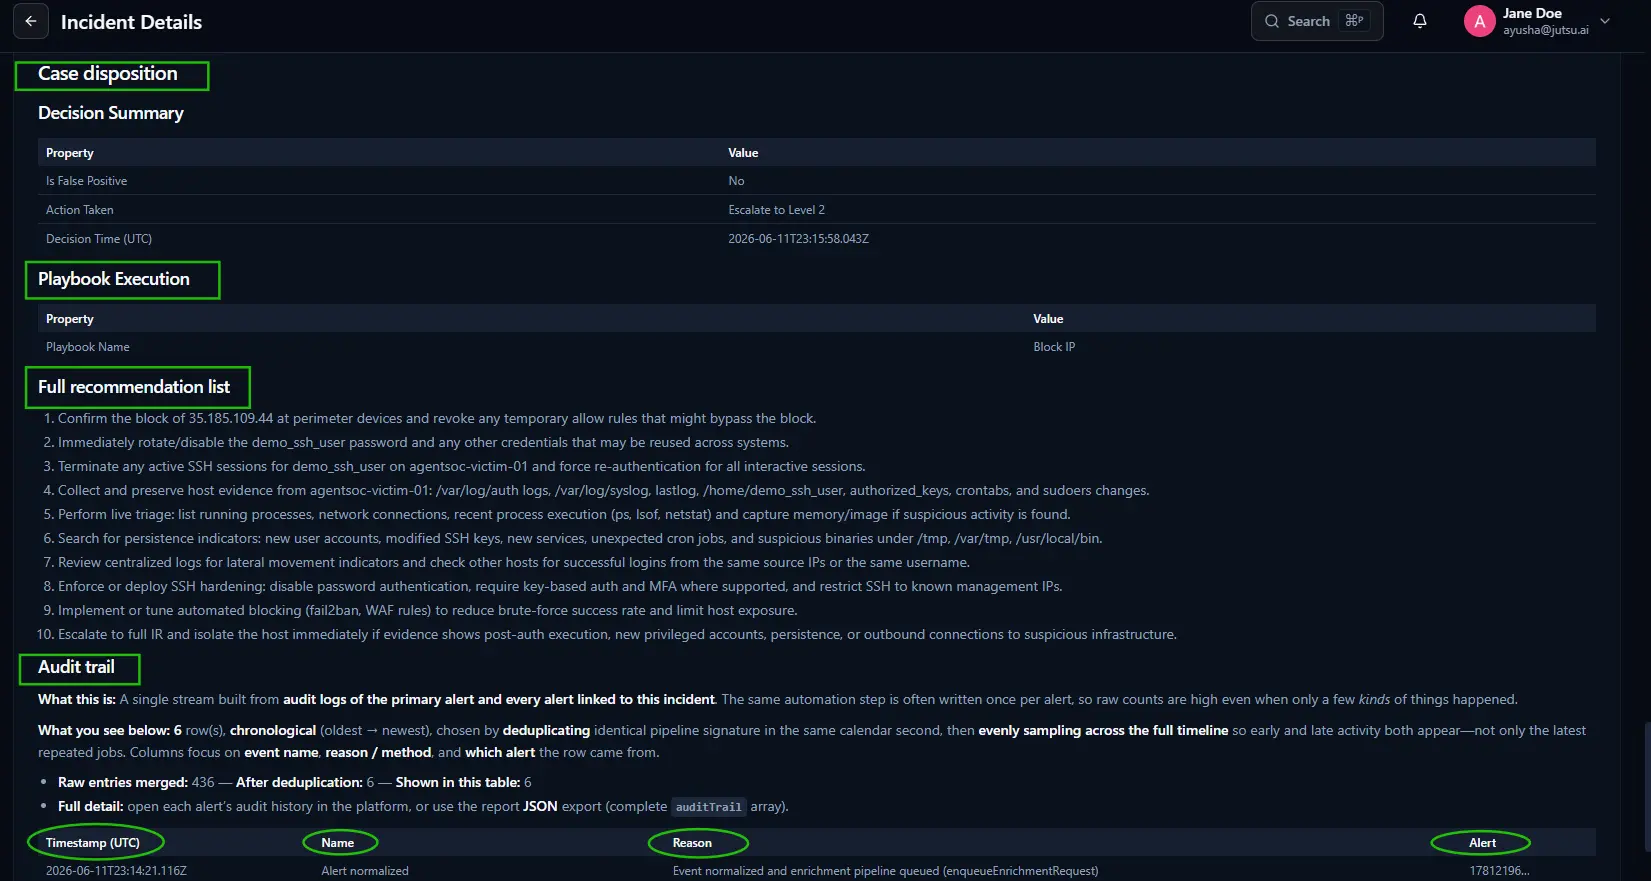
Decision Summary
A structured table showing the outcome of the AI's triage decision:
- Is False Positive -- Whether the AI classified this incident as a false positive.
- Action Taken -- The action the AI took, for example Escalate to Level 2.
- Decision Time (UTC) -- The exact timestamp of when the routing decision was made.
Playbook Execution
Shows which AgentSOAR playbook was automatically executed as part of the response, for example Block IP. If no playbook was executed, this section will be empty.
Full Recommendation List
The complete list of all AI-generated remediation and investigation recommendations for this incident, numbered in priority order. This is the extended version of the Your Next Steps section shown earlier in the report -- it includes all recommendations including any that were truncated in the summary.
Audit Trail
A single consolidated stream built from the audit logs of the primary alert and every alert linked to this incident.
The description at the top explains how the table is constructed: raw audit entries are deduplicated by identical pipeline signatures within the same calendar second, then evenly sampled across the full timeline so that both early and late activity are represented. The summary line shows the total raw entries, the count after deduplication, and how many rows are shown in the table.
A note below directs you to the full detail: open each alert's audit history in the platform or use the report JSON export to access the complete audit trail array.
The table itself shows four columns:
- Timestamp (UTC) -- The exact time of the audit event.
- Name -- The name of the pipeline step or action that occurred.
- Reason -- A description of what happened at that step and why.
- Alert -- The Alert ID the audit entry came from.
Downloadable pdf
The PDF is a formatted, printable version of everything covered in the Report tab -- the same information, structured as a standalone document. It includes the report metadata, At a glance summary, Executive Summary, Your next steps, full Incident summary, Correlation analysis, Primary alert reference, Linked alerts by type, Anomaly / UEBA signals, Incident and processing timeline, Correlated detections, Threat Analysis, Impact Assessment, Risk Narrative, and the full Appendix covering evidence and traceability, triage and enrichment reference, Case disposition, Playbook execution, Full recommendation list, and Audit trail.
The footer of each page shows the Report ID, page number, and generation timestamp. A document information note on the final page confirms the report was generated by the AgentSOC incident reporting service and that full structured data is available in the paired JSON artifact and the live incident record in the platform.
The PDF is suitable for sharing with stakeholders, storing as a compliance record, or attaching to a post-incident review. It does not update after download -- use New report in the platform to regenerate with the latest data, then download again.
Timeline Tab
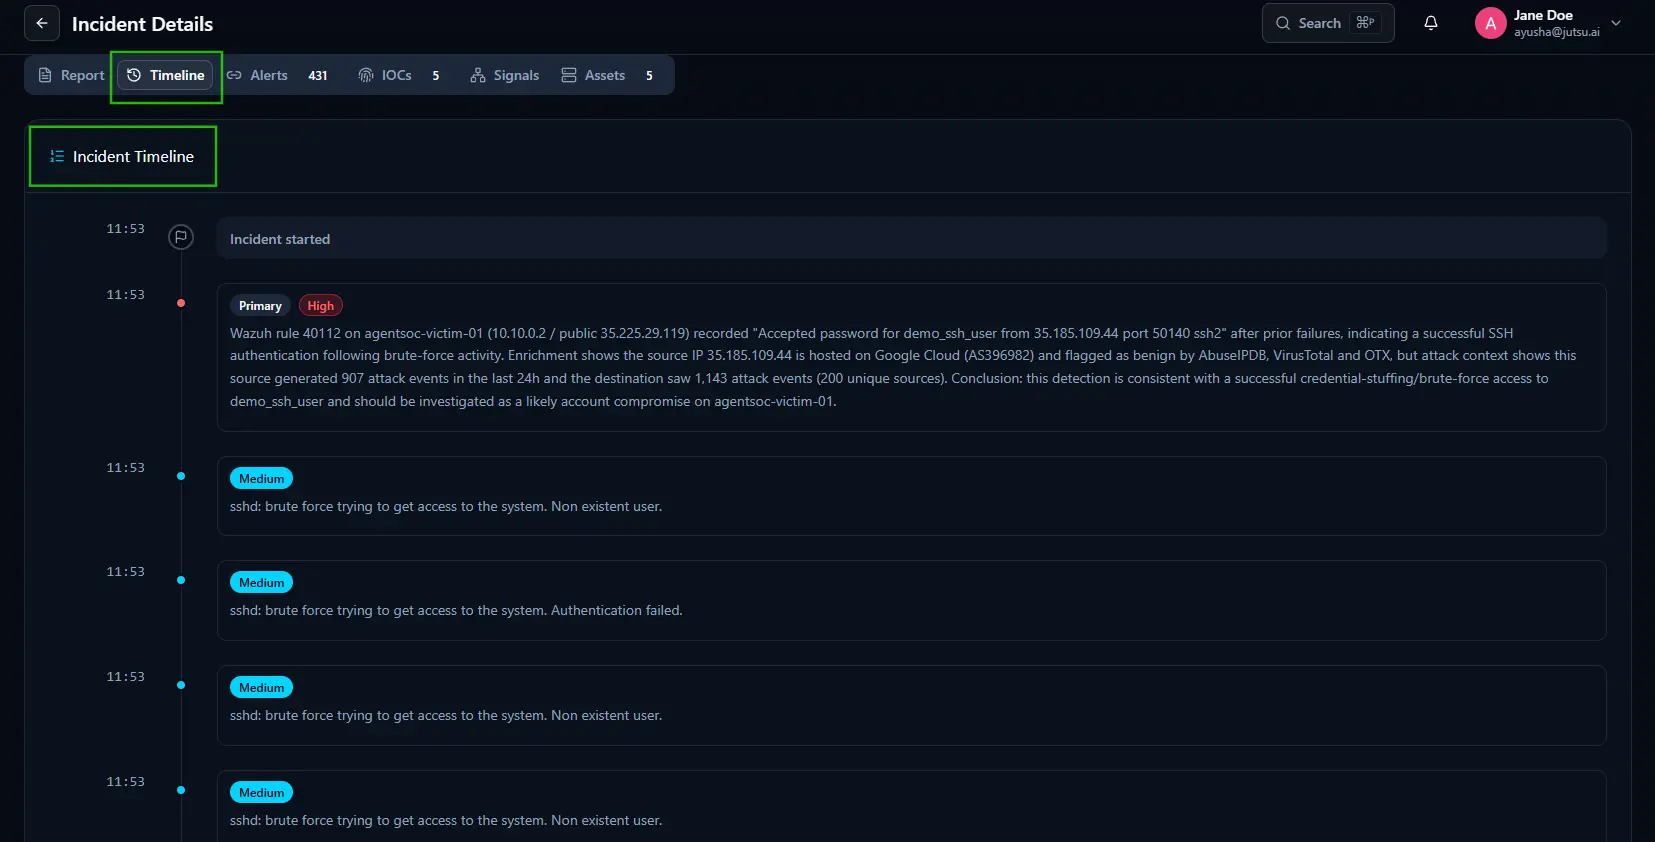
The Timeline tab shows a chronological view of every alert correlated into this incident, displayed as a vertical timeline. Each entry is timestamped on the left and shows a severity badge and the alert description.
The first entry marks when the incident started. The primary anchor alert is labeled with a Primary badge alongside its severity badge and contains the full AI verdict narrative for that alert. All subsequent entries show the correlated alerts in order, each with their severity badge and a brief description of what was detected.
The color of the dot on the timeline corresponds to the severity of that alert -- making it easy to scan the timeline visually and identify where the highest-severity activity occurred and in what sequence.
This tab is useful for understanding the chronological progression of the attack -- when it started, how it developed, and which detections fired at each stage.
Alerts Correlation Tab
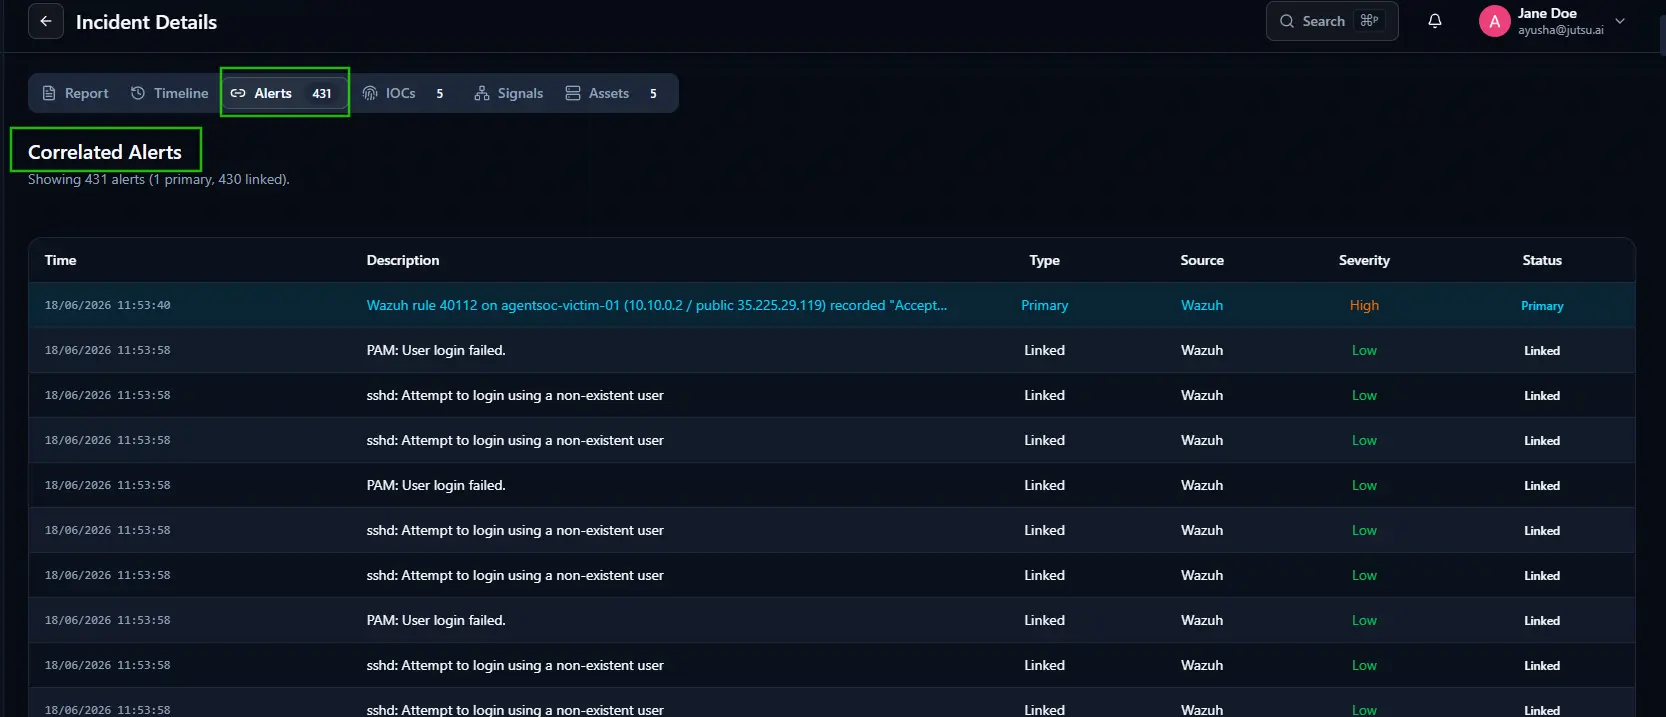
The Alerts tab lists every alert and event correlated into this incident. The header shows the total count split between the primary alert and linked alerts.
Each row in the table represents one alert. The columns are:
- Time -- The date and time the alert was detected.
- Description -- A plain-language description of what was detected. The primary alert description is shown as a clickable link -- click it to open the full Alert Detail for that alert.
- Type -- Whether the alert is the Primary anchor alert or a Linked correlated alert.
- Source -- The data source that generated the alert.
- Severity -- The severity level assigned to the alert, color-coded for quick scanning.
- Status -- Whether the alert is the Primary or Linked within this incident.
The primary alert row is highlighted in a distinct color to distinguish it from the linked alerts at a glance. Click any alert description to open its full Alert Detail page.
IOCs Tab
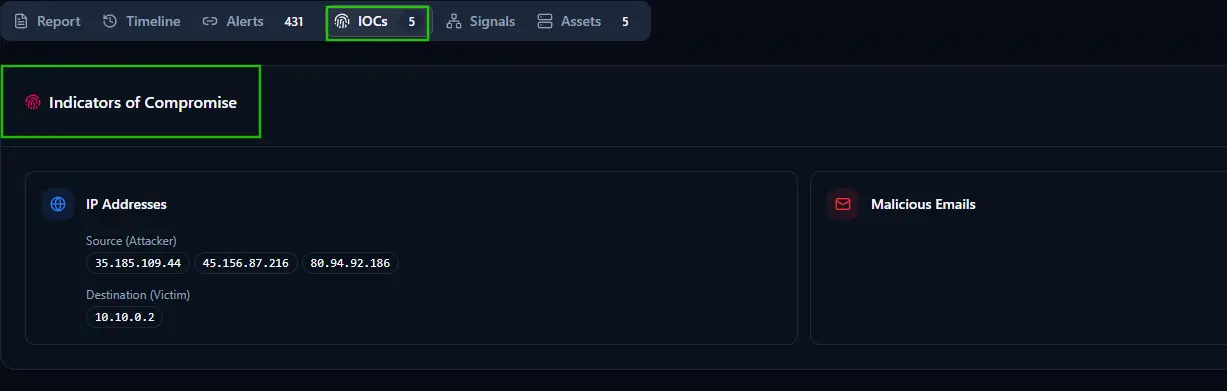
Indicators of Compromise (IOCs) are pieces of evidence that suggest a system has been or is being attacked. They are the observable artifacts extracted from the alerts in this incident -- IP addresses, domains, file hashes, email addresses, and other identifiers that can be used to detect, block, or investigate the threat further.
The IOCs tab consolidates all indicators extracted across every correlated alert in this incident into one place. The count shown on the tab reflects the total number of unique IOCs found.
IOCs are grouped by type:
- IP Addresses -- Split into Source (Attacker) IPs and Destination (Victim) IPs. Source IPs are the external addresses the attack originated from. Destination IPs are the internal addresses that were targeted.
- Malicious Emails -- Email addresses or domains associated with malicious activity detected in this incident. Shown when email-based IOCs are present.
Each IOC is displayed as a tag. Use these values when configuring blocks in AgentSOAR, updating firewall rules, or sharing threat intelligence with other teams.
Signals Tab
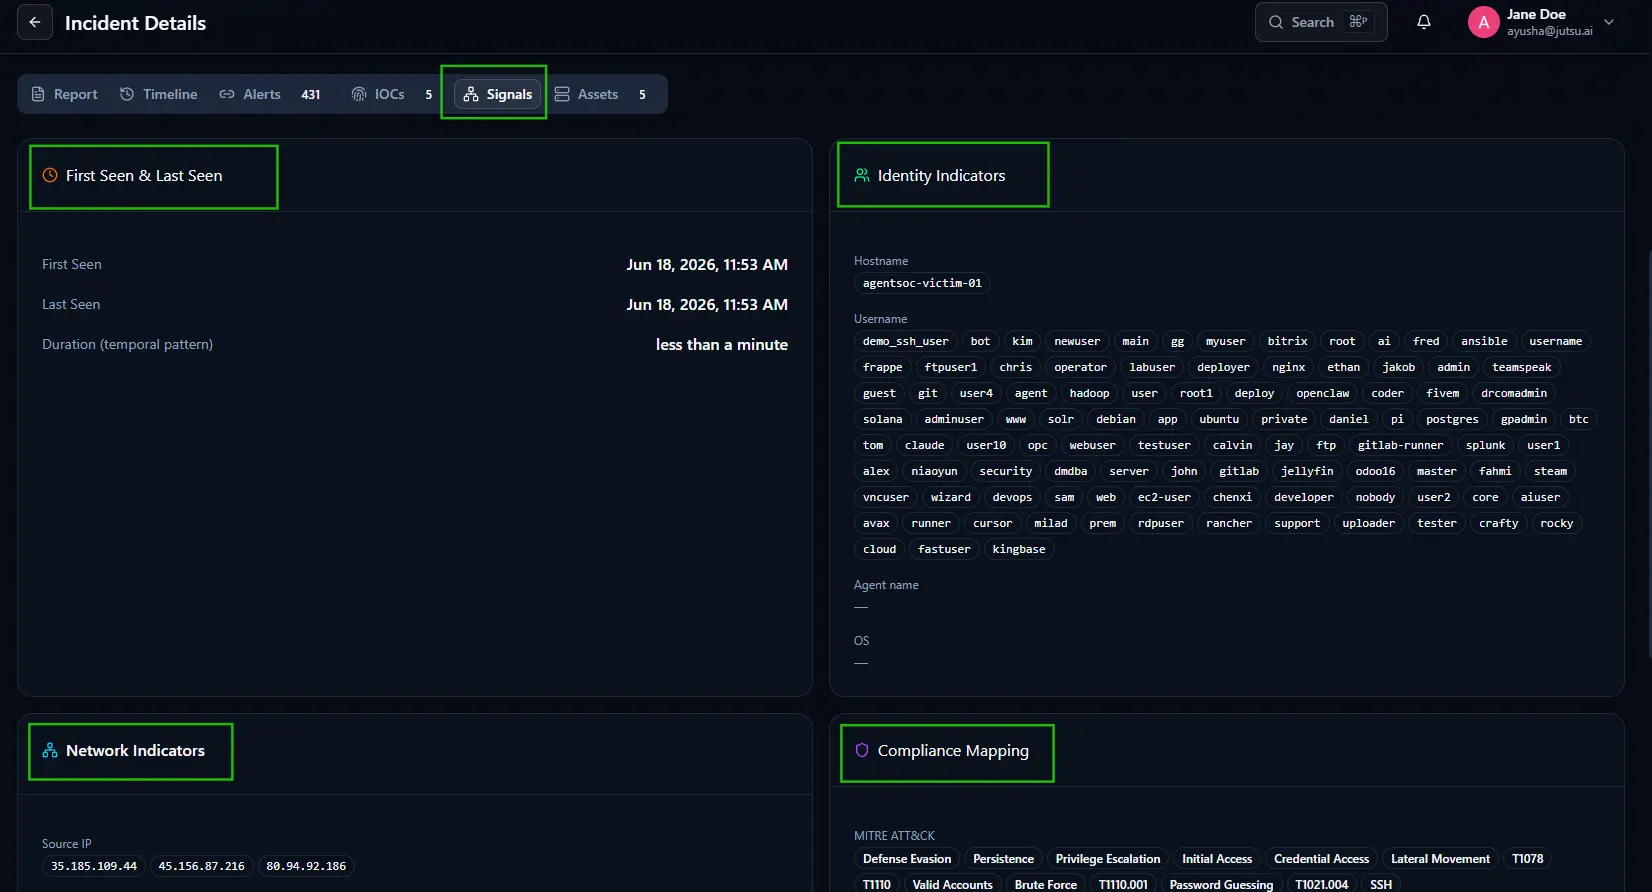
The Signals tab shows the detection signals and correlation evidence the AI used to group the alerts in this incident. It is broken into four sections.
First Seen & Last Seen
Shows the time window of the incident:
- First Seen -- When the earliest activity in this incident was detected.
- Last Seen -- When the most recent activity was detected.
- Duration (temporal pattern) -- The total time span of the incident from first to last detection.
Identity Indicators
Shows the identity-related observables extracted across all correlated alerts:
- Hostname -- The internal host or hosts targeted in this incident.
- Username -- Every username that appeared across the correlated alerts. In a brute-force campaign this list reflects every account the attacker attempted to access.
- Agent name -- The Wazuh agent name associated with the alerts, if available.
- OS -- The operating system of the targeted host, if available.
Network Indicators
Shows the network-level observables extracted across all correlated alerts:
- Source IP -- All external IP addresses that appeared as attack sources across the incident.
Compliance Mapping
Maps the activity in this incident to regulatory and threat frameworks:
- MITRE ATT&CK -- All tactics and technique IDs identified across the correlated alerts, displayed as tags. This gives a complete picture of the attack surface covered by this incident across the MITRE framework.
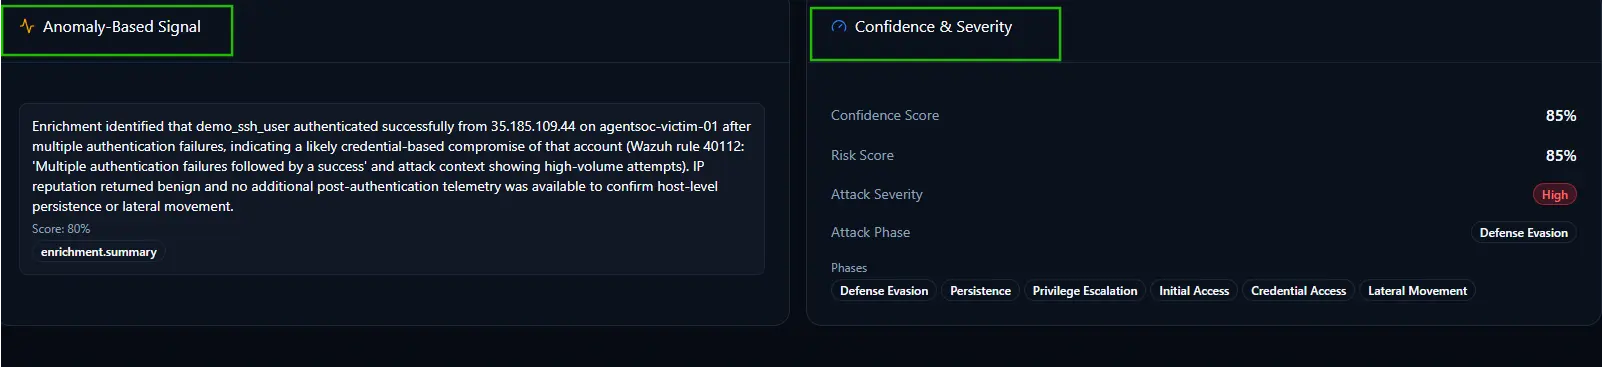
Anomaly-Based Signal
Shows any User and Entity Behavior Analytics (UEBA) signals identified during enrichment. These are behavioral anomalies that go beyond standard rule-based detections -- patterns that suggest suspicious activity even when individual events appear normal in isolation. Each signal includes a plain-language description of what was detected, a confidence score, and the source that generated the signal.
Confidence & Severity
A summary of the AI's overall assessment of this incident:
- Confidence Score -- How confident the AI is in its overall verdict for this incident.
- Risk Score -- The overall risk level assigned to this incident.
- Attack Severity -- The severity classification of the attack, shown as a colored badge.
- Attack Phase -- The primary MITRE ATT&CK phase the AI identified as the current stage of the attack.
- Phases -- All MITRE ATT&CK phases observed across the incident, displayed as tags. This shows the full breadth of the attack across the kill chain.
Assets Tab
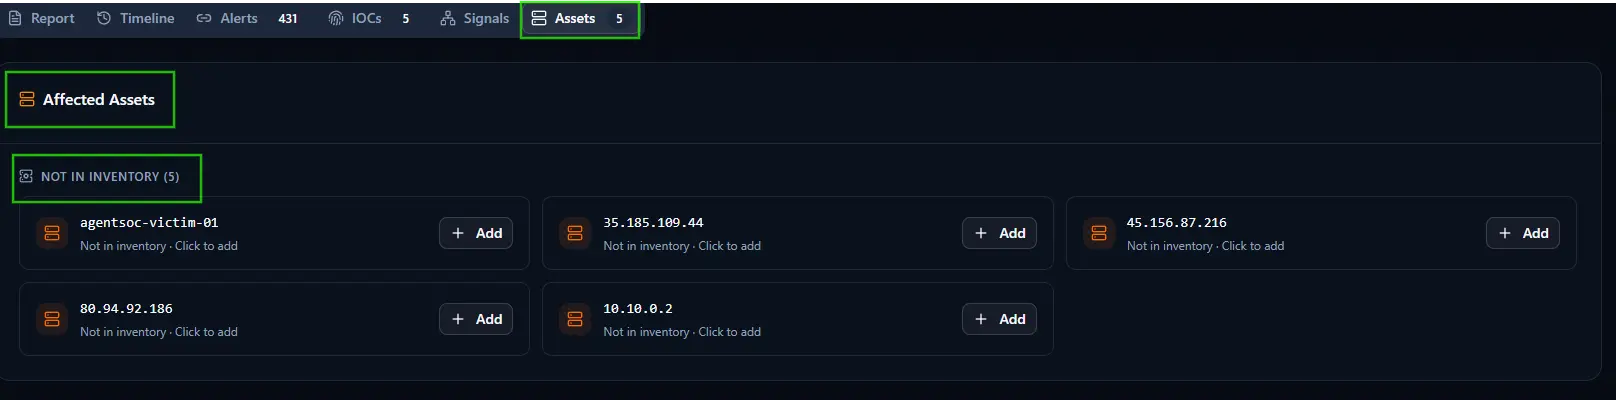
The Assets tab lists all assets involved in this incident, both internal hosts and external IP addresses observed across the correlated alerts.
Assets are grouped by their inventory status. The Not in Inventory section shows assets that were detected in the incident but do not currently exist in your Assets inventory. The count in the section header shows how many untracked assets were found.
Each asset card shows the hostname or IP address and a note confirming it is not in inventory. Click the Add button on any card to add that asset directly to your Assets inventory without leaving the incident. This makes it easy to keep your inventory up to date as new systems are discovered through investigation.