Start Here – Dashboard
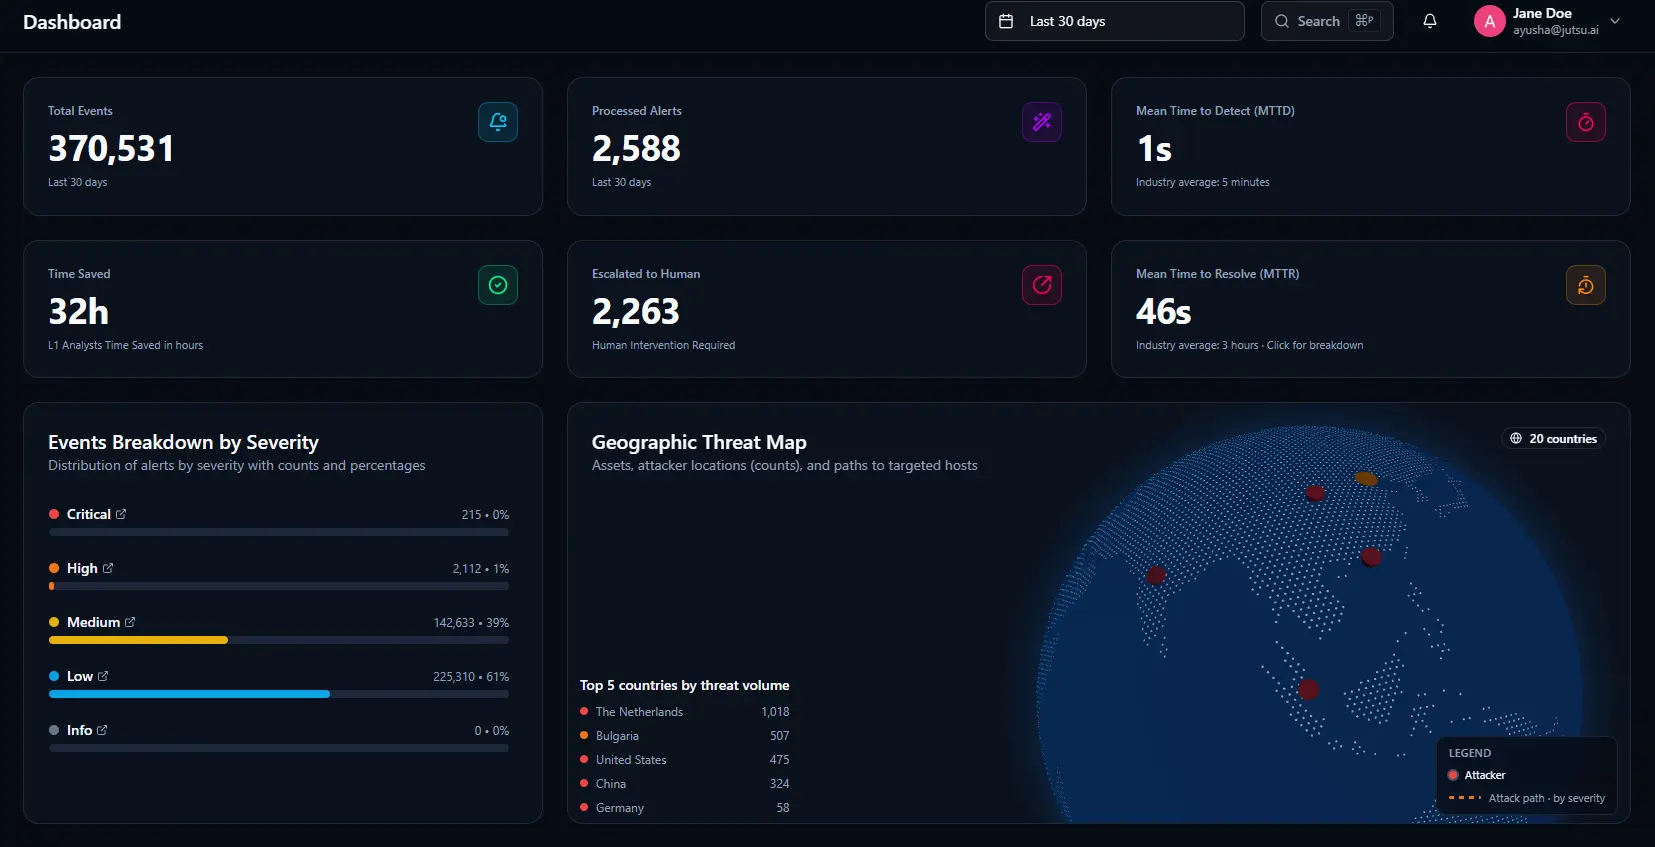
The Dashboard is the first screen after login and your daily starting point. In under a minute you can see how busy today is, whether anything critical is open, and whether the AI has created Cases waiting for your team.
Path: Dashboard at the top of the left sidebar (opens automatically on login).
Time Range
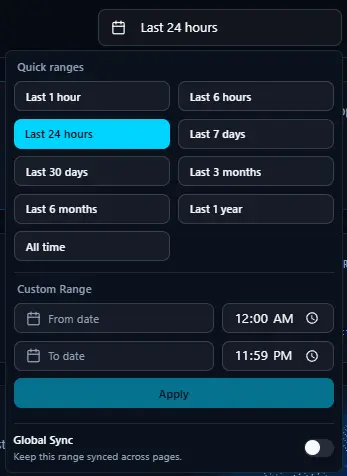
Every number on the Dashboard reflects the selected time window. Default is Last 24 hours. Click the time range button (top right) to change it -- presets from Last 1 hour to All time, plus Custom Range. The Global Sync toggle at the bottom of that dropdown applies your window to every page in the platform simultaneously.
If numbers show zero: Check the time range. Expanding to Last 7 days is a good first step when the dashboard appears empty.
The Six Metric Cards
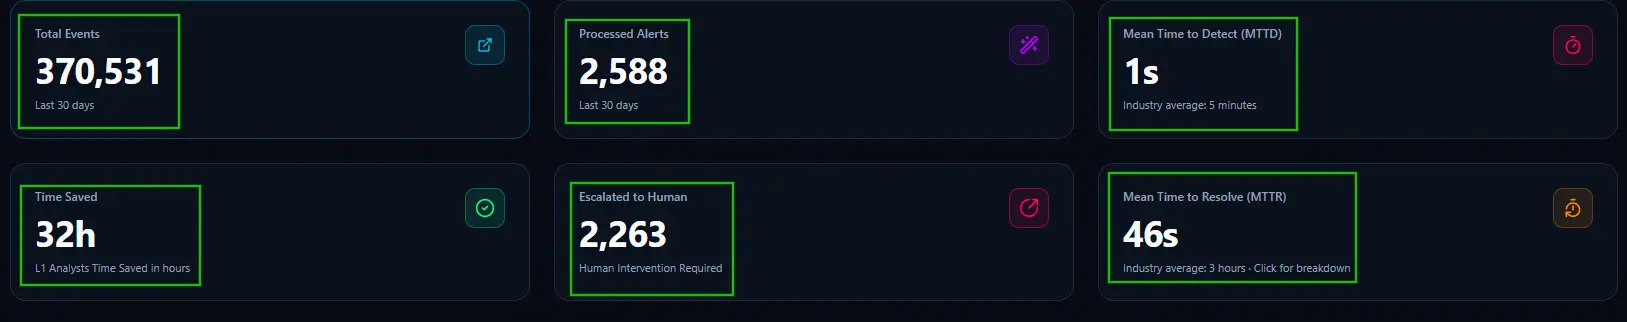
Total Events -- Every raw log entry received from your connected systems in the selected period -- logins, file access, network connections, and emails. Reflects the full volume of data the AI worked through.
Processed Alerts -- How many of those events the AI flagged as suspicious enough to investigate. The ratio between this and Total Events reflects how efficiently the AI is filtering signal from noise. Click the card to open the Alerts list.
Mean Time to Detect (MTTD) -- How fast the platform catches threats. It measures the average time between a threat occurring and an alert being generated. The lower this number, the faster threats are being detected in your environment. The platform shows an industry average of five minutes so you can benchmark your detection speed.
Time Saved -- The estimated number of analyst hours the AI has saved in the selected period by automatically handling normalization, enrichment, triage, correlation, and routing -- work that would otherwise fall on your team. Starts at zero on new deployments and grows as the platform processes more volume.
Escalated to Human -- The number of alerts the AI investigated but could not confidently resolve on its own. These have been converted into Cases and assigned to your team for human judgment. If this number is non-zero, Cases are waiting. Click the card to go directly to the Cases queue.
Mean Time to Resolve (MTTR) -- The average time from when an alert is detected to when the resulting Case is closed. This reflects how quickly escalated investigations are being handled. The platform shows an industry average of three hours for comparison. Click the card for a breakdown of resolution time by stage.
Events Breakdown by Severity
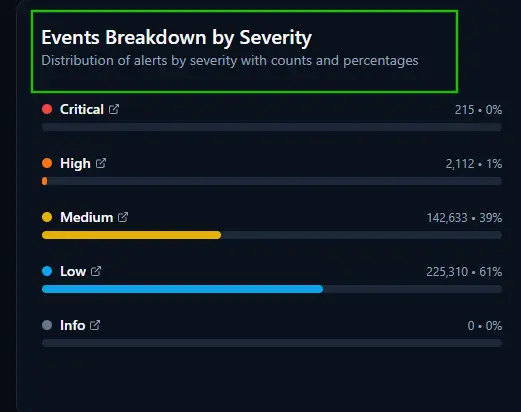
Shows the distribution of alerts across five severity levels: Critical, High, Medium, Low, and Info. Each row displays a count, a percentage of total alerts, and a color-coded progress bar. Click the external link icon next to any severity level to jump directly to the Alerts list filtered to that severity.
Geographic Threat Map
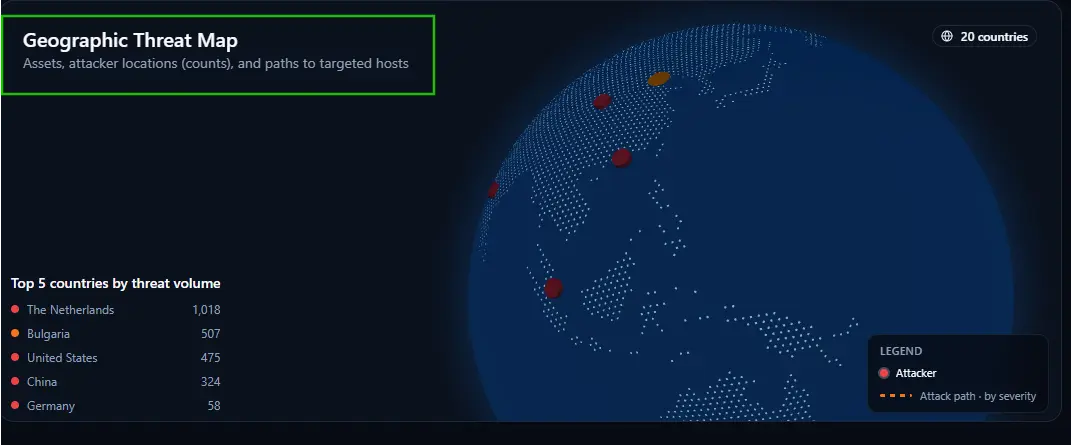
Plots attacker locations, your asset locations, and the paths between them on a world map. The counter in the top right shows the total number of countries with active threat activity. The Top 5 countries by threat volume panel lists the highest-activity source countries with their alert counts. Hover over any point on the map to see location details.
Top Attackers, Top Hosts, Top Attacks
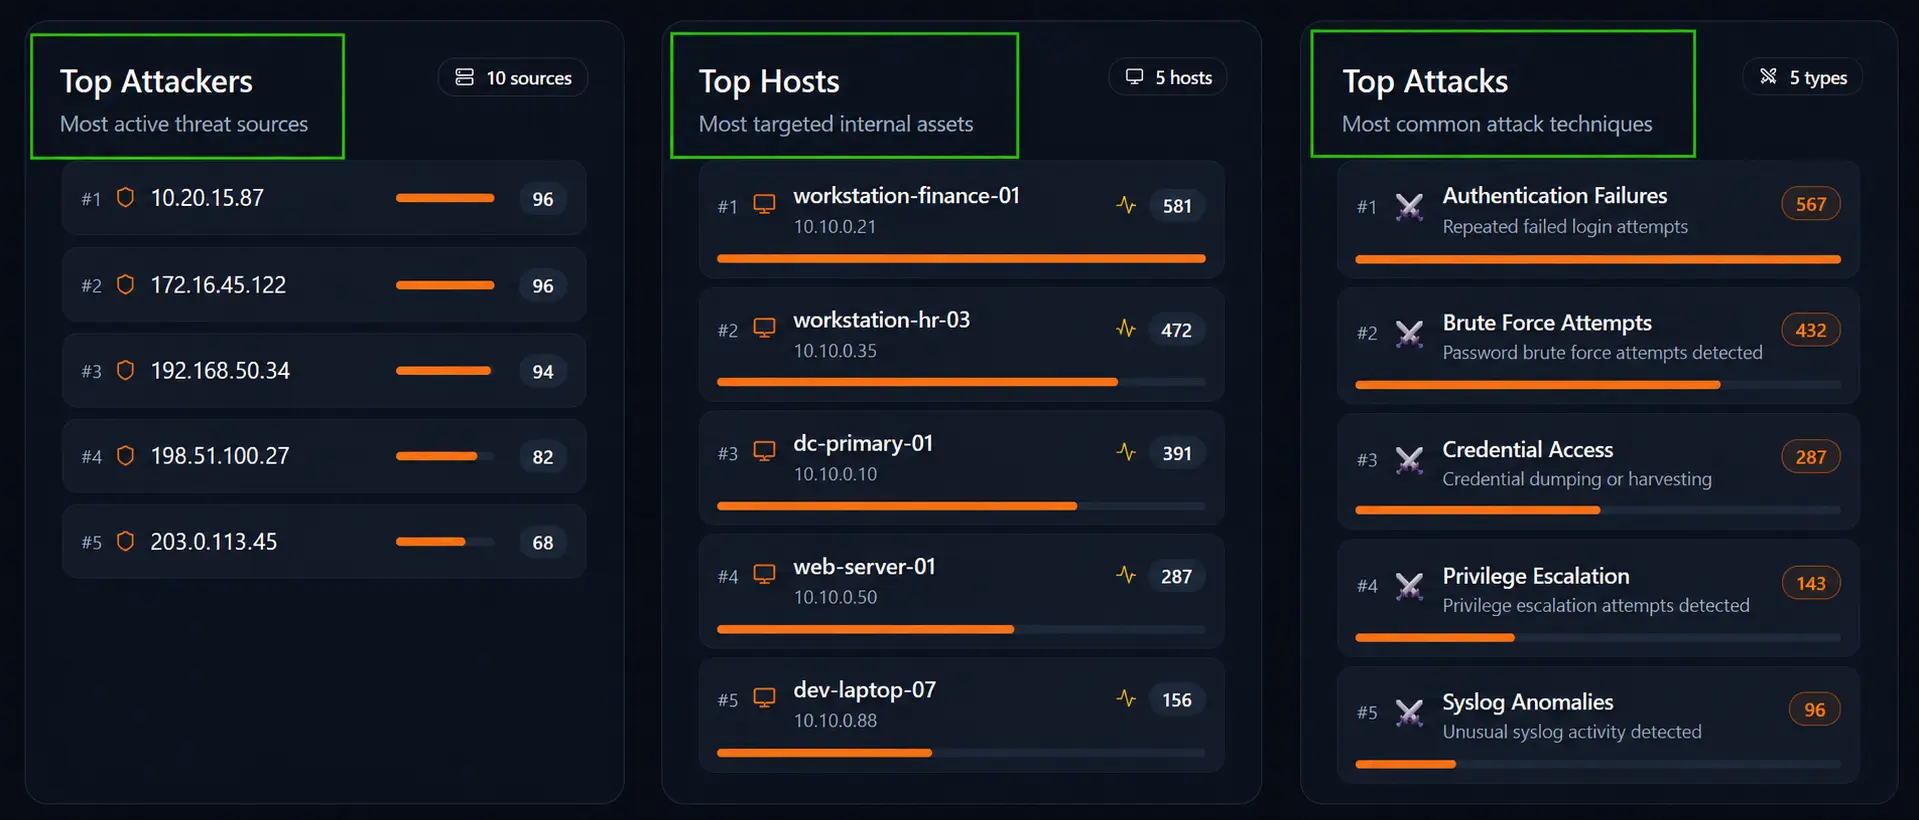
Top Attackers -- Lists the most active threat sources in the selected period, ranked by alert count. Each entry shows the source IP address and its total alert count. The counter in the top right shows the total number of unique sources detected.
Top Hosts -- Lists the most targeted internal assets, ranked by alert count. Each entry shows the hostname, IP address, and total alert count. The counter in the top right shows the total number of targeted hosts. Click any host to see its related alerts.
Top Attacks -- Lists the most common attack techniques observed, ranked by alert count. Each entry shows the technique name, a brief description, and its total alert count. The counter in the top right shows the total number of distinct attack types detected.
MITRE ATT&CK Framework Coverage
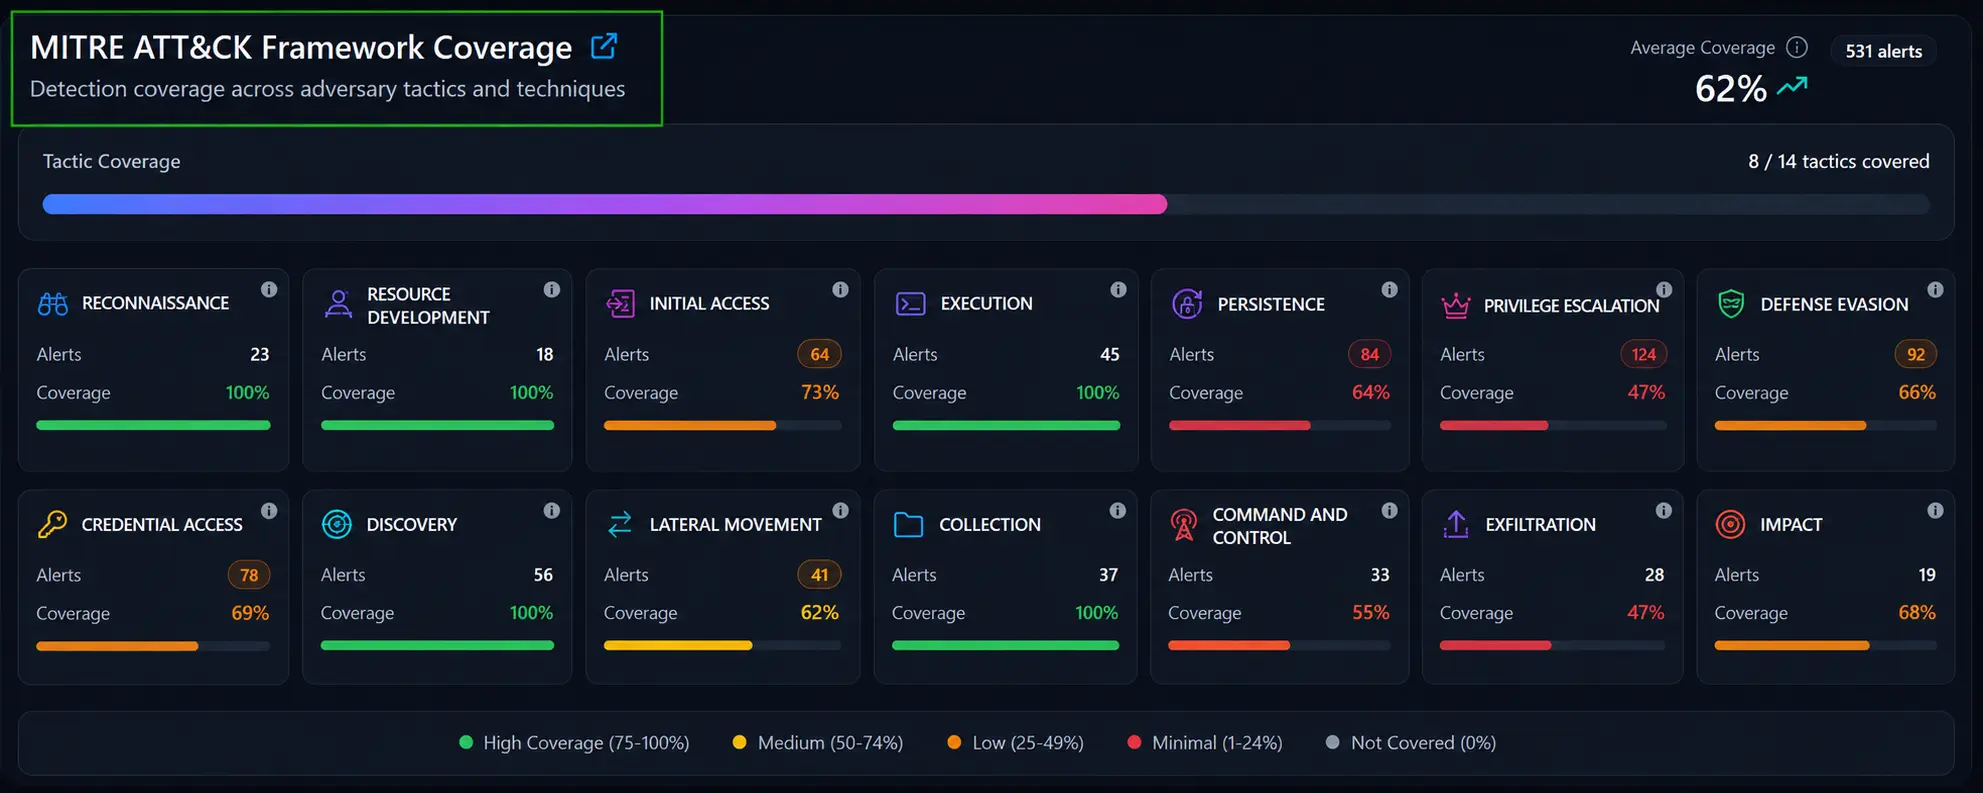
MITRE ATT&CK is a publicly maintained framework cataloguing every tactic and technique used by real-world attackers. Tactics are high-level goals (like Initial Access or Lateral Movement). Techniques are the specific methods used to achieve them (like SSH brute force or pass-the-hash). Jutsu/AgentSOC maps your detected alerts to this framework automatically.
Coverage shows how your alert activity maps across the fourteen top-level tactics. Each tile is color-coded: High Coverage (75%+), Medium (50-75%), Low (25-50%), Minimal (<25%), No Coverage. Click any tactic tile to see the technique-level breakdown.
Compliance Framework Mapping
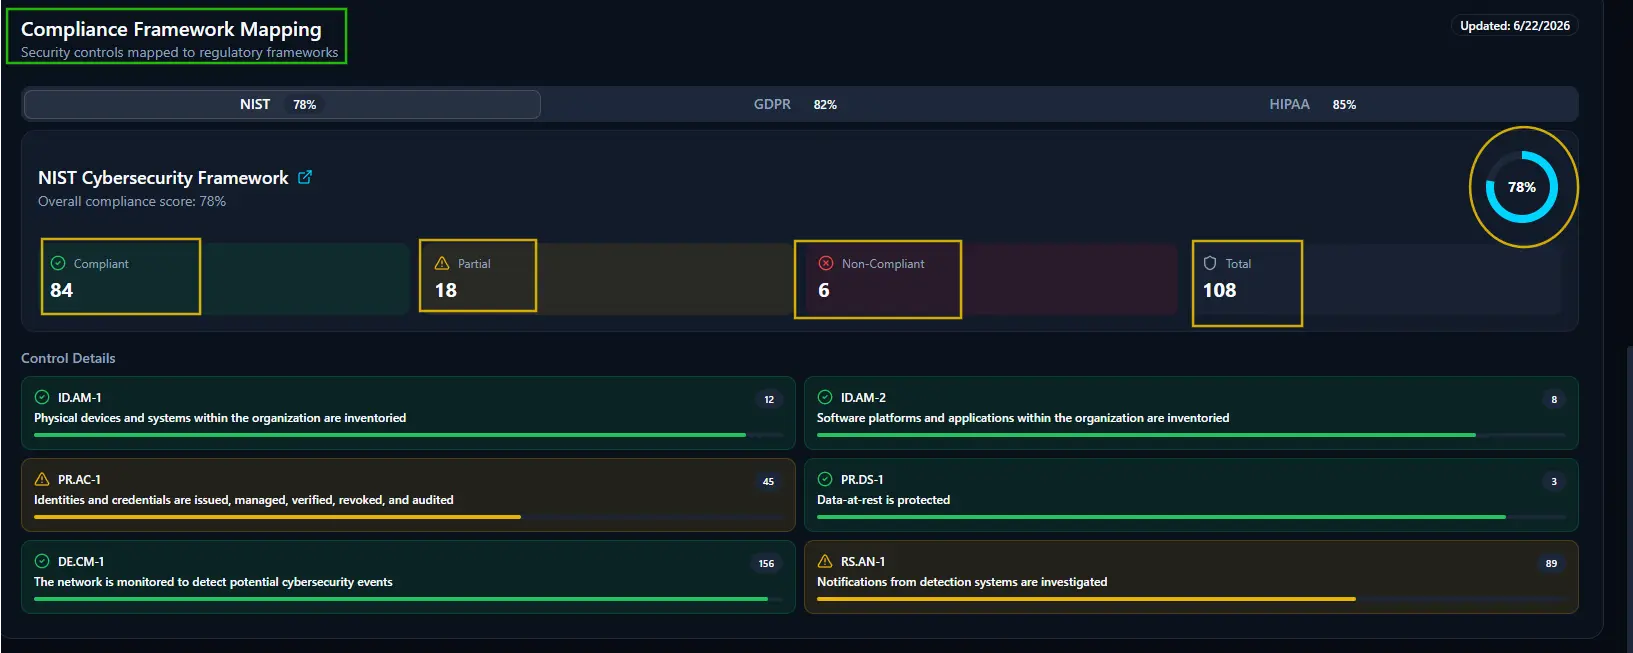
Maps your security activity against three regulatory frameworks: NIST, GDPR, and HIPAA.Click any tab to switch between frameworks.
NIST -- The National Institute of Standards and Technology Cybersecurity Framework. A set of guidelines and best practices for managing cybersecurity risk, widely adopted across industries in the United States and globally.
GDPR -- The General Data Protection Regulation. A European Union regulation governing how organizations collect, store, and protect personal data. Applies to any organization handling data of EU residents.
HIPAA -- The Health Insurance Portability and Accountability Act. A U.S. regulation requiring healthcare organizations and their partners to protect the privacy and security of patient health information.
Each framework tab shows an overall compliance score as a ring chart, broken down into four counters:
- Compliant -- Controls fully satisfied based on current alert and detection activity.
- Partial -- Controls where some requirements are met but gaps remain.
- Non-Compliant -- Controls with no evidence of the required activity.
- Total -- Total number of controls mapped for this framework.
Control Details -- Lists individual controls below the score. Each control card shows the control ID (e.g. ID.AM-1), a description of what the control requires, a status icon (green checkmark for compliant, yellow warning for partial, red cross for non-compliant), an alert count showing how many alerts are contributing to that control's status, and a color-coded progress bar reflecting coverage level. Click any control card to see the specific alerts mapped to it.