
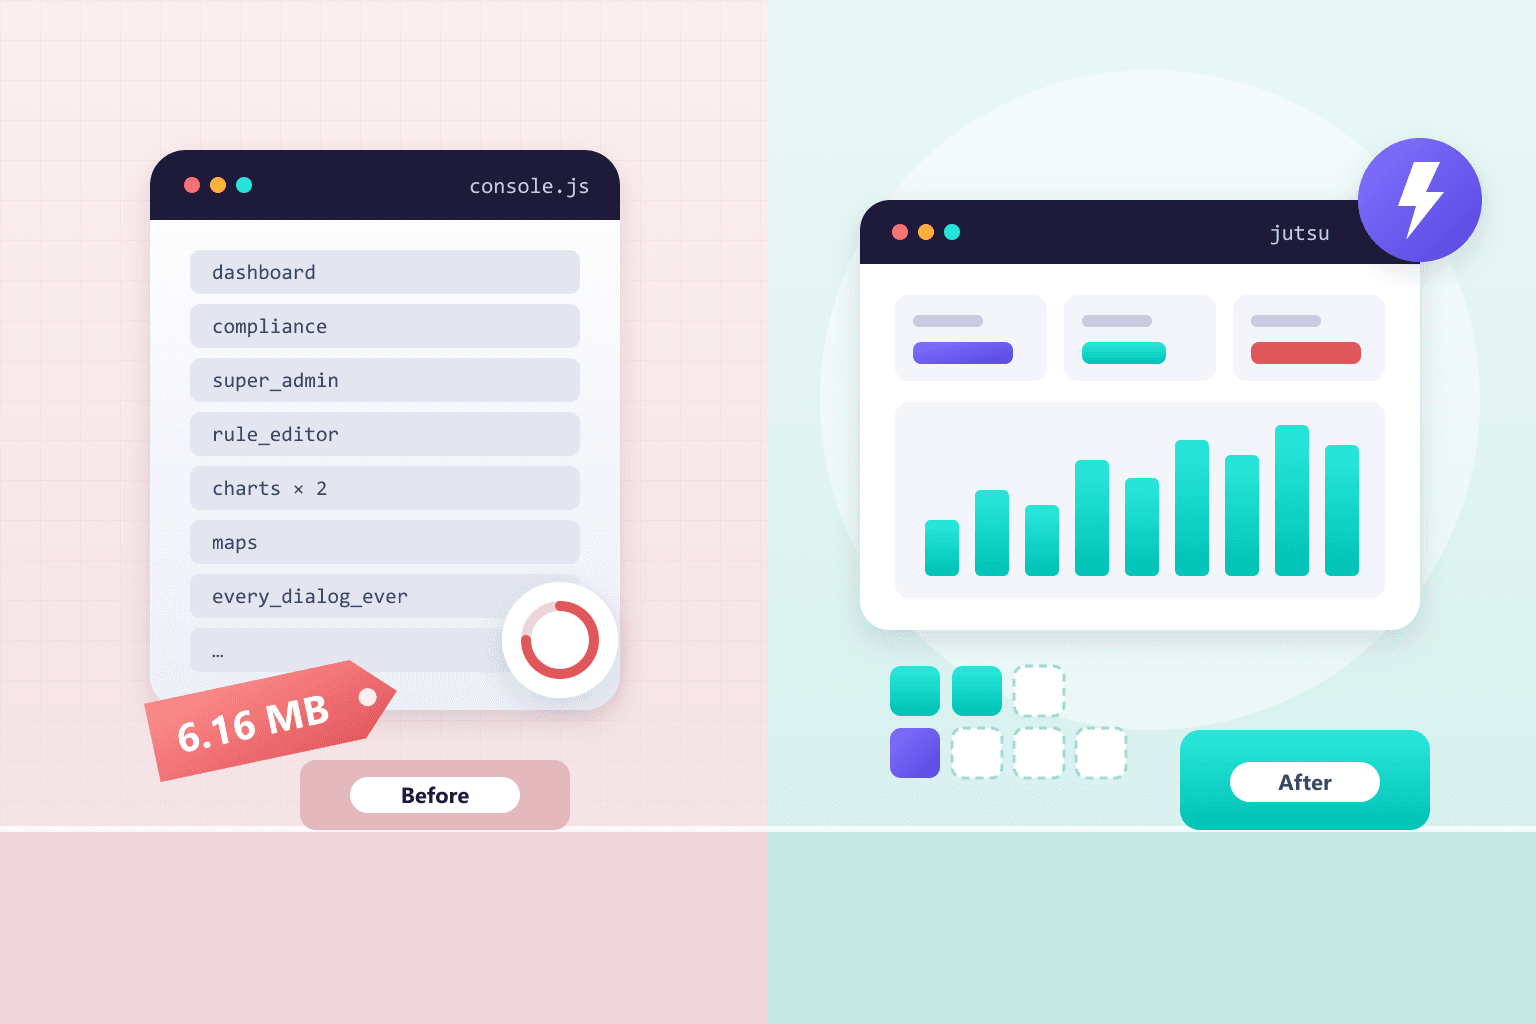
Until last week, opening the Jutsu dashboard downloaded the compliance module, the super admin panel, a full code editor, two charting libraries, a map renderer and every integration dialog we’ve ever built. All of it, before the first pixel appeared. It was like ordering an espresso and having the café hand you the whole café.
So we went through every console page and the API behind it, looking for requests that were wasted, duplicated, too big or badly timed. We fixed what was safe to fix and measured everything before and after. Pages are now usable in about half the time, download 73% less JavaScript, and spend 73% less time in ClickHouse. The best part: page times now stay flat whether an org has 100 events or 5 million.
No new servers. No rewrite. We just stopped doing things nobody asked for.

Key takeaways
- Across 23 console pages, time to usable fell 48%, first paint fell 61%, and main-thread blocking fell 74%.
- The console used to ship as one 6.16 MB script. Now every page loads on demand, and the first download is 376 KB gzipped, down from 1.81 MB.
- ClickHouse queries fell 40% and ClickHouse time fell 73%, mostly because the alert and incident lists stopped rereading the tenant’s entire history every 15 seconds.
- From 100 to 5,000,000 events, data pages now hold at 0.7 to 1.4 seconds. Before, they took 1.5 to 3.6 seconds.
- We fixed five real bugs along the way, including a Reports poller that ran forever and threw away every answer it got.
Why a SOC console has to be fast
A slow security console isn’t just annoying. When an alert fires at 2 a.m., the analyst opens the dashboard, clicks into the alert, jumps to the incident and checks the events. Every second spent watching a spinner is a second the attacker gets for free. And it adds up: a triage pass touches a dozen pages, and an analyst does dozens of triage passes a day.
Jutsu’s AI agents do a lot of the triage on their own, which you can read about in What Is an Agentic SOC?. But the cases they escalate go to a person, and that person should get a console that keeps up with them.
How we measured it
Localhost lies. On your own machine every request is free, which hides exactly the kind of waste we were looking for. So we tested the real production build, served gzipped the way our CDN serves it, in Edge under Playwright, with the network slowed to 40 ms of latency and 20 Mbit/s. Every page load started with a cold cache, and we took the median of three runs.
The data came from a throwaway benchmark org created through the same path as a real customer’s, with its own databases and our ~145 built-in detection rules. We seeded it at six sizes, from 100 events up to 5 million events with 250,000 alerts. No customer data was touched, and the org was torn down afterward.
One honest caveat: this ran on a developer laptop, so individual timings jumped around by up to 25% between near-identical runs. Request counts, bytes and query counts are exact. Read the timing numbers as direction and size, not to the millisecond.
The results
| Sum across 23 pages | Before | After | Change |
|---|---|---|---|
| Time to usable | 41.83 s | 21.59 s | −48% |
| First contentful paint | 36.26 s | 14.22 s | −61% |
| Main-thread blocking | 7.67 s | 1.99 s | −74% |
| JavaScript transferred | 39.64 MB | 10.72 MB | −73% |
| API requests, incl. preflights | 570 | 518 | −9% |
| Postgres queries | 619 | 562 | −9% |
| ClickHouse queries | 77 | 46 | −40% |
| ClickHouse time | 5.55 s | 1.51 s | −73% |
Every page got faster. Most dropped by 34% to 67%. The Action Center went from 2.56 s to 956 ms, and the Dashboard went from 2.36 s to 790 ms. The one laggard is Connections, which improved by only 8%, because its page still carries every connect dialog we have. It knows what it did, and it’s next on the list.

What was actually slow
1. The whole console was one giant file
The console was a single 6.16 MB script, 1.81 MB gzipped. No page was split out. So if you just wanted to look at the dashboard, you first downloaded and parsed the rule editor, the compliance screens, the admin panel and the charting code for pages you weren’t going to open.
Now all 94 routed pages load on demand. The first download dropped to 1.28 MB, or 376 KB gzipped. Splitting alone would have created a new problem, since the page couldn’t start downloading until the login check answered. So the console now fetches the page you’re opening at the same time as that check. Once things settle, it quietly prefetches the main sections in the background, unless you’ve turned on Save-Data. We also skipped a ~300 ms placeholder that React holds for lazy pages, so a page that’s already loaded shows up immediately.

2. Every request knocked twice
Browsers send a “may I?” request, called a CORS preflight, before many cross-origin API calls. Our API never told the browser it could remember the answer, so it asked again before nearly every request. The dashboard sent 15 of them for 15 real requests, and every 15-second poll paid the toll again. Imagine a coworker who asks “can I ask you a question?” before every single question, all day.
The browser now remembers the answer for two hours. So once a URL has been asked about, every repeat request to it, like a dashboard poll every 15 seconds, skips the extra round trip. The first request to each URL still knocks once, and some URLs carry fresh timestamps that make them look new every time, which is on our to-do list.

3. The alert list reread your entire history every 15 seconds
This was the big one on the database side. To show one page of alerts, the alerts list, its stats and its filters joined triage, enrichment and verdict data from across the tenant’s whole history, going back as far as two years of partitions. Every 15 seconds. It’s like rereading your whole diary to remember what you had for lunch. The incident list did the same.

Each of those lookups is now limited to the time window the list is actually showing. Before shipping, we ran the old and new queries side by side on real ClickHouse with triage, enrichment and verdict data in place, and they returned identical results. The saving grows with the size of your history, so long-running customers gain the most.
A few more database fixes went in at the same time:
- The Action Center ran one ClickHouse query per open incident, up to 50 of them, to rank them. It now runs one query for all of them, and its ClickHouse time per load is 20 to 40 times lower.
- Incident detail stopped building its linked-alerts join from every alert the tenant owns.
- The policy acceptance banner read every member’s acknowledgements, up to 50,000 rows, to answer a question about one person. Now it reads only yours.
- Several endpoints that ran independent reads one after another now run them in parallel.
4. Requests nobody asked for
Plenty of requests were technically correct and completely pointless:
- Copilot chat history loaded on every page, with the Copilot panel closed.
- The dashboard fetched the entire asset list, with telemetry, just to count it. As a bonus, the count couldn’t go past 500. It now asks for the count directly, with no cap.
- Incident detail downloaded comments, evidence and the team roster for a tab that’s disabled.
- The plan card requested billing details for users who aren’t allowed to see them, got a 403, and showed a red error every visit.
- Up to six components on one screen fetched the same plan list. Identical requests that are already in flight are now shared, with guardrails: a read never joins one that started before a write, and a stuck request never swallows newer ones.
5. Background tabs that wouldn’t let go
You know that console tab you opened Tuesday and forgot about? It was still polling every 15 seconds, like a dog waiting by the door. Live Events, Connections, Assets, the platform pages and the ingest banner all kept refreshing in hidden tabs. Now they pause when you look away and catch up when you come back.
It stays fast as your data grows
Making a demo org fast is easy. The question that matters is what happens at real scale, so we ran the whole suite at 100, 1K, 10K, 100K, 1M and 5M events.

Before, data pages took 1.5 to 3.6 seconds. After, they hold flat at 0.7 to 1.4 seconds at every size. There’s one exception we’re not going to hide: at 5M events, the Dashboard’s event breakdown takes 1.1 to 1.5 seconds when its cache is cold. We didn’t touch that code in this pass, and it’s at the top of the next one.
Testing at 5M also caught a bug of our own before it shipped. The first version of the batched Action Center query used a column alias that quietly switched off the index. Instead of looking up 50 incidents’ worth of events, it read every event the tenant had: all 5 million. We renamed the alias, added a test, and made a mental note to never trust a query we haven’t run at scale.
Bugs we fixed along the way
When you read every request a page makes, you also find the ones that were simply wrong:
- Reports polled forever and threw away the answer. Open the page with a report running and it would ask for status every 5 seconds until you closed the tab, and the table never showed the run finishing. Very zen, not very useful.
- Marking a notification read cut your list to 50. After “Load more,” one click sent you back to page one.
- Alert detail refreshed two to four times every time you switched back to the tab.
- The response-policy page could wipe your unsaved edits whenever your session refreshed in the background.
- Product tours could start before a page had loaded and skip its steps.
What you’ll notice, and the small trade-offs
Mostly, pages just show up faster. A few things work a little differently:
- If you leave a tab open across a console update, it reloads once the next time you go to a page you haven’t opened yet.
- New invitations reach the notification bell within two minutes. The notifications page itself is still instant.
- Team member pickers can lag up to 30 seconds behind changes someone else made. Your own edits always show up right away.
- The organization overview now shows your real asset count, even past 500.
There’s also one place where we got a little slower, and it’s only fair to mention it. If you click into Alerts within the first two and a half seconds of opening the console, before the background prefetch kicks in, that first visit downloads the page (568 ms before, 986 ms now). After that it’s at or below the old time.
What’s next
We left a few changes for a separate pass because they change an API or what you see on screen:
- Event search and breakdowns at large scale. The Dashboard computes 18 event fields and displays 3. Asking only for what’s on screen, and reading common counts from precomputed hourly rollups, should fix the 5M cold-cache case.
- A lighter rules list. The rules page downloads the full body of every rule, 690 KB for 145 rules, when the list only needs a summary.
- Fewer requests at startup. Every cold load still makes about nine small setup requests that could be folded into one.
- A second pass on bundle size. The command palette, product tours and connect dialogs can load when you first use them, not when the console boots.
The bottom line
None of this was clever. No new infrastructure, no exotic caching layer, no rewrite in a trendier framework. We measured honestly, found the places where the console was doing work nobody needed, and stopped doing it. The result is a console that’s about twice as fast and does far less database work, and keeps both as your data grows.
If you want to feel the difference yourself, Jutsu has a Free plan with 5 assets and 50 AI investigations a month, no credit card. New to AI-driven security operations? Start with What Is an AI SOC?
FAQ
How much faster is the Jutsu console now?
Across 23 pages, the total time until pages were usable fell 48%, from 41.83 seconds to 21.59 seconds, with each page loaded cold on a throttled connection. First paint fell 61%, and most individual pages got 34% to 67% faster.
Does the console slow down for organizations with a lot of data?
In our tests from 100 to 5,000,000 events, data pages held at 0.7 to 1.4 seconds at every size. The one exception is the Dashboard’s event breakdown at 5M events when its cache is cold, at 1.1 to 1.5 seconds, which is the next thing we’re fixing.
Did anything change about how alerts and incidents are shown?
No. The alert and incident lists now read less data, but we checked the old and new queries side by side on real ClickHouse and they return identical results.
Do I need to do anything to get the faster console?
No. It’s live for every organization. If a console tab was open across the update, it reloads once when you open a new page.